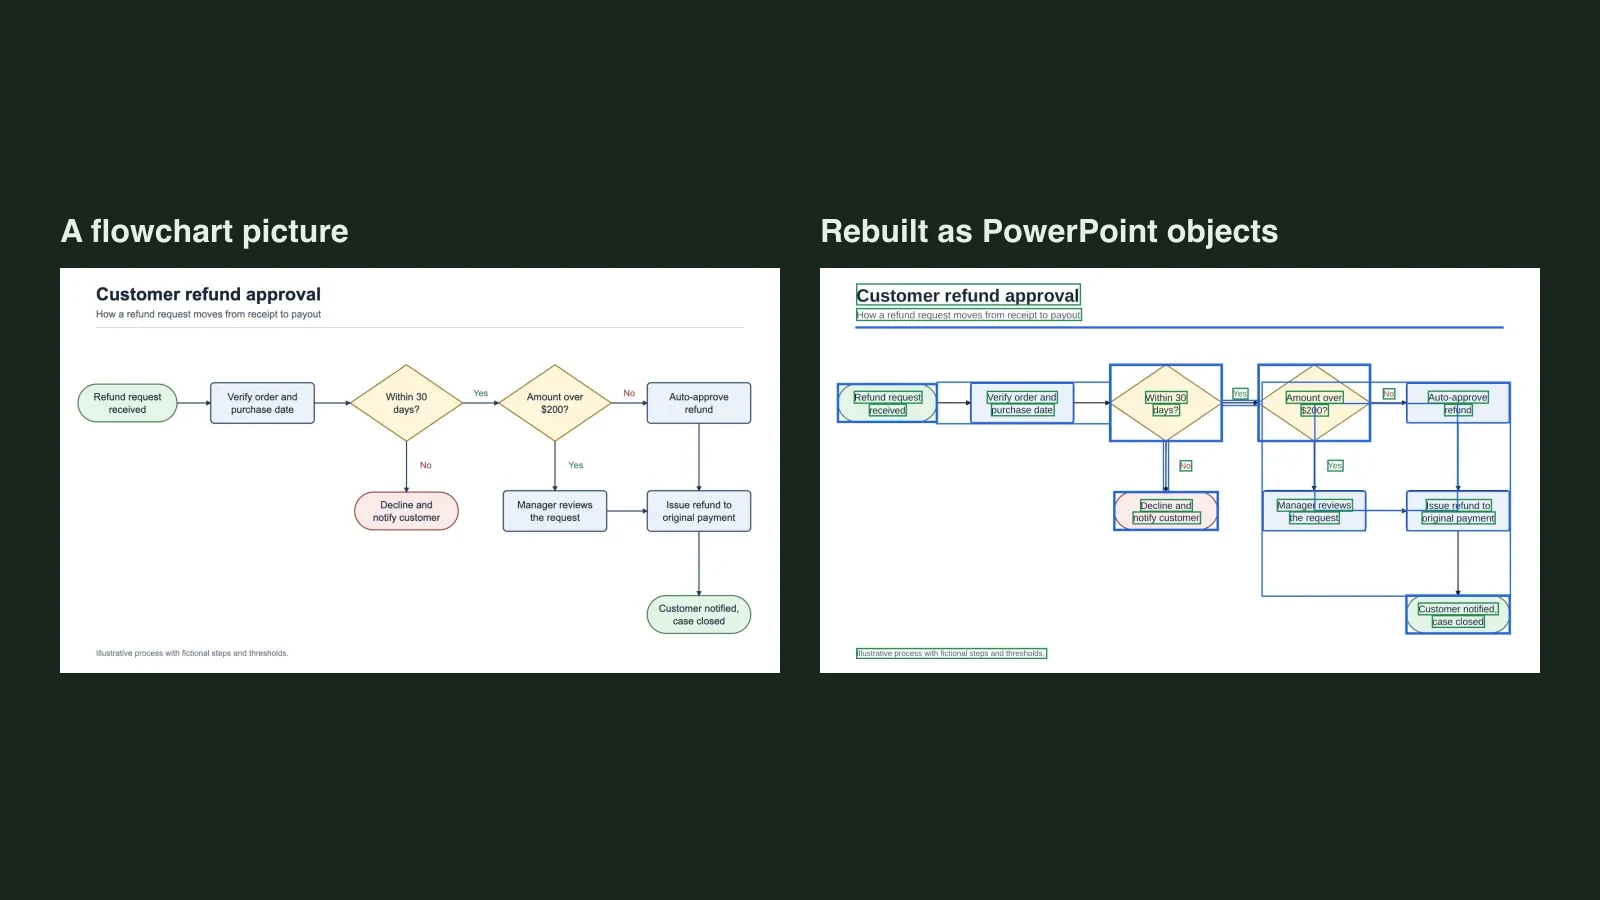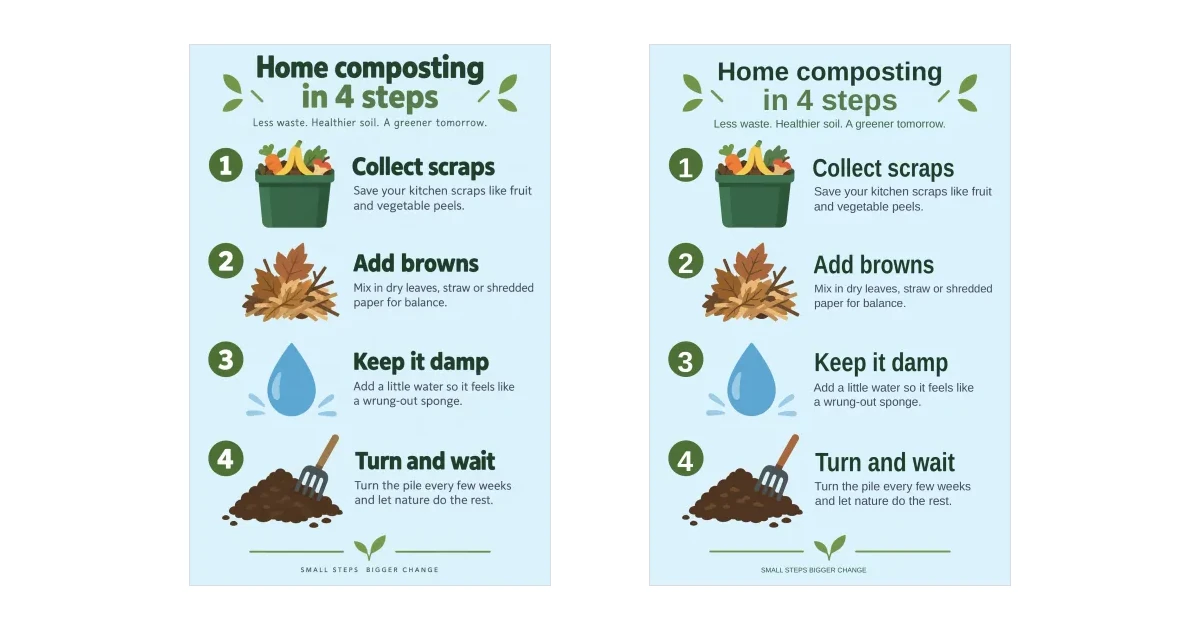
Quick answer: The three tools do not deliver the same thing. On three busy infographics tested on 15 Nov 2026, Unraster rebuilt the artwork as 298, 88 and 222 vector shapes you can drag, recolour and delete. Codia NoteSlide kept icons and charts as pictures (5, 11 and 14 shapes) and Tosea put most of the artwork in a full-page background picture (0 shapes). That is the difference between restyling a figure for your journal or deck and redrawing it by hand.
You have a picture of a slide, a figure or an infographic, and you want it to open in PowerPoint as something you can change. Three tools do this from a web page. They do not all give you the same kind of "editable", and the gap shows up on busy images with icons, charts and several columns, not on a clean list of bullet points. So we tested them on busy images.
We make Unraster, so read this as a test run by a vendor. Every number below comes from the exported files, the method is in the last section, and the limits of the test are in their own section.
The result in one table
One asymmetry up front: for Unraster we counted the full unlocked file, while Codia and Tosea were counted on their free tiers (see the method section). Counts come from slide 1 of each exported .pptx, tested 15 Nov 2026. On a phone, swipe the table sideways to see the Tosea column. The three numbers in each cell are the three test images in order: graphical abstract / charts infographic / steps infographic.
| Unraster | Codia NoteSlide | Tosea | |
|---|---|---|---|
| Editable text boxes | 74 / 54 / 62 | 43 / 51 / 32 | 53 / 43 / 24 |
| Vector shapes (no text) | 298 / 88 / 222 | 5 / 11 / 14 | 0 / 0 / 0 |
| Pictures in the slide | 0 / 0 / 0 | 28 / 17 / 33 | 15 / 9 / 9, including a full-page background |
| Full-page background picture | No | No | Yes, every slide |
| Words missing from editable text | 0 / 0 / 0 (a rotated y-axis label on image 1 is present but collapsed to a sliver) | 0 / 0 / 4 (script footer is a picture) | about 34 / 7 / 7 |
| Free clean download | No: free preview is watermarked, download is paid | Yes, free plan includes 5 credits | Watermarked only |
| Native PowerPoint chart | No | No | No |
| Time per image | 85 to 123 s (three jobs at once) | about 30 to 50 s | about 16 to 30 s |
| Watermark | Not on the unlocked file | None on our exports | Burned into the picture |
| What we ran | Full unlocked file | Free credits | Free plan |
A higher count is not automatically better. We split lines more finely, which inflates our text-box number; total characters were close across the tools. The rows that matter are vector shapes and pictures, because they say what you can actually select and recolour.
Test 1: a scientific graphical abstract
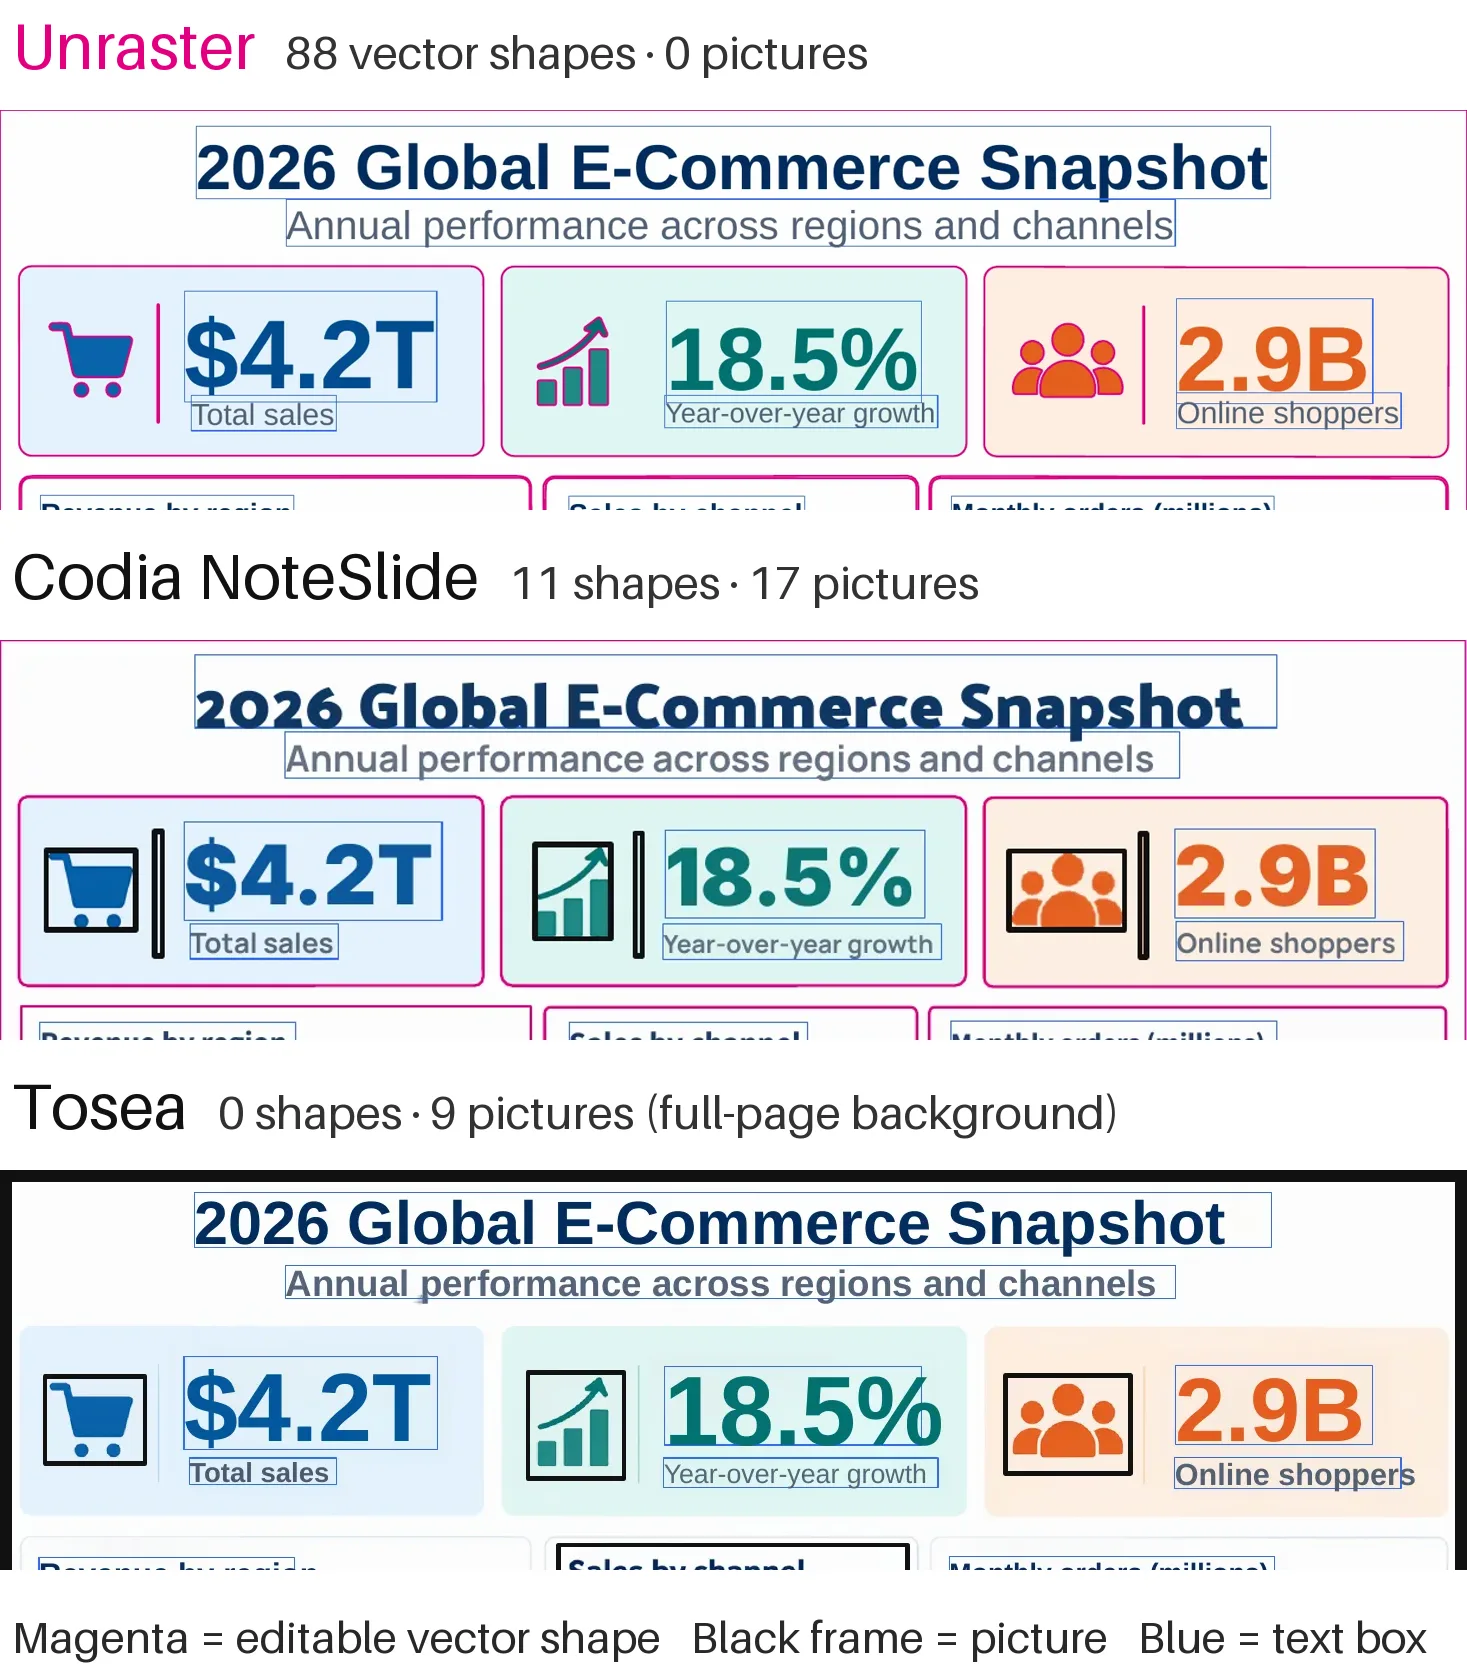
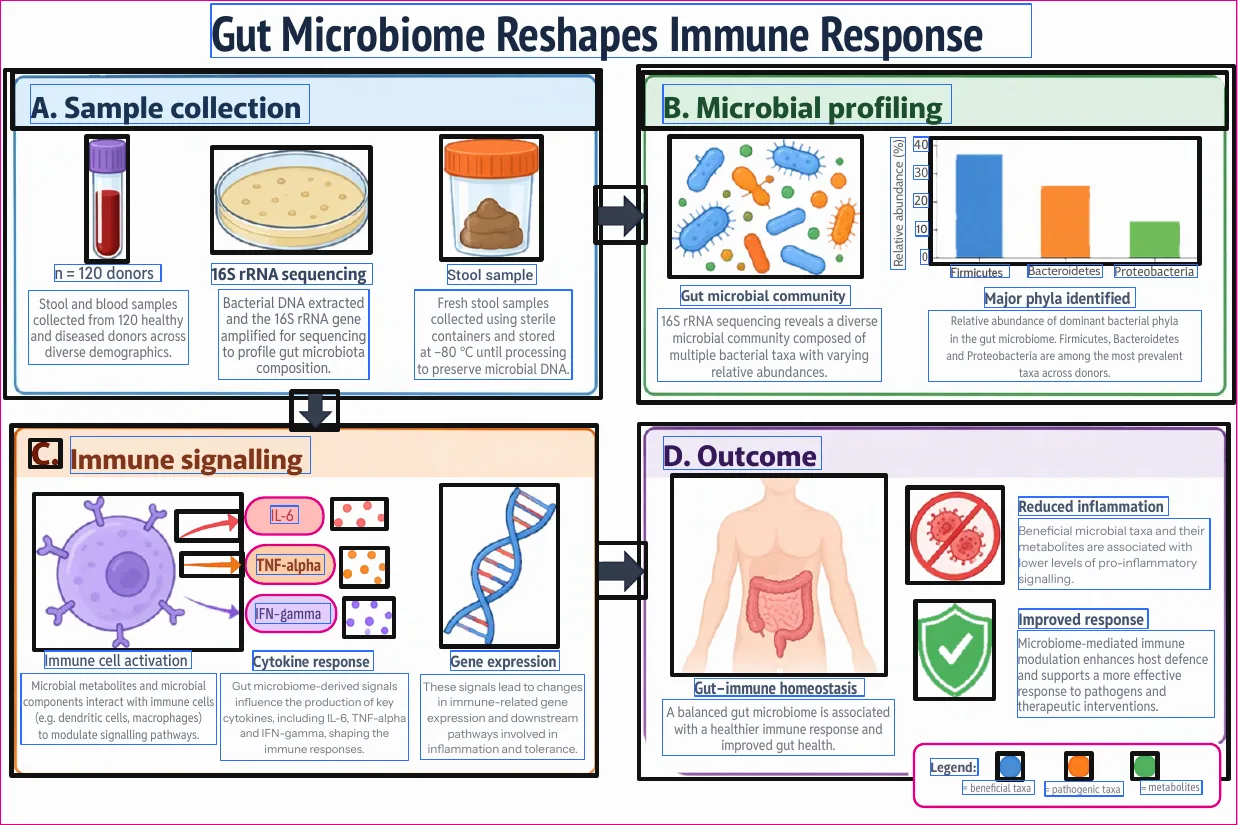
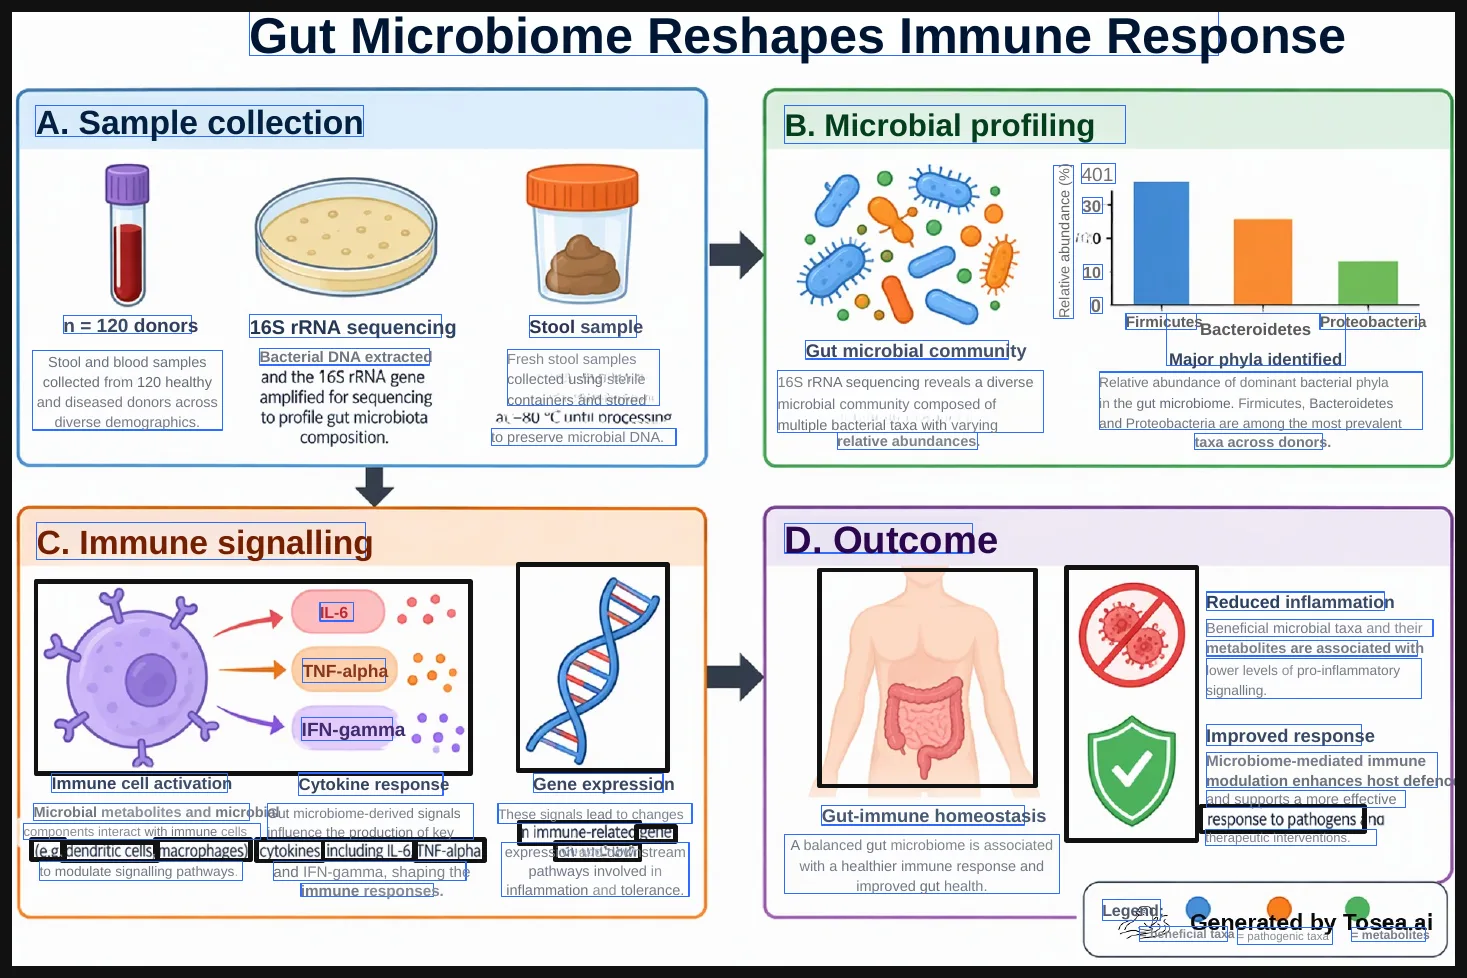
How to read the result images: each export is drawn with outlines added. Magenta = a vector shape you can select, drag and recolour. Black frame = a picture (it can move, but its insides cannot be edited or recoloured); a thick black frame around the whole slide is a full-page background picture. Blue = a text box. More magenta and fewer black frames mean more of the slide is editable. Tap any image to open it full size.
A four-panel figure with a bar chart, a cell, DNA, a shield and a colour legend. This is the kind of image researchers want in a slide.
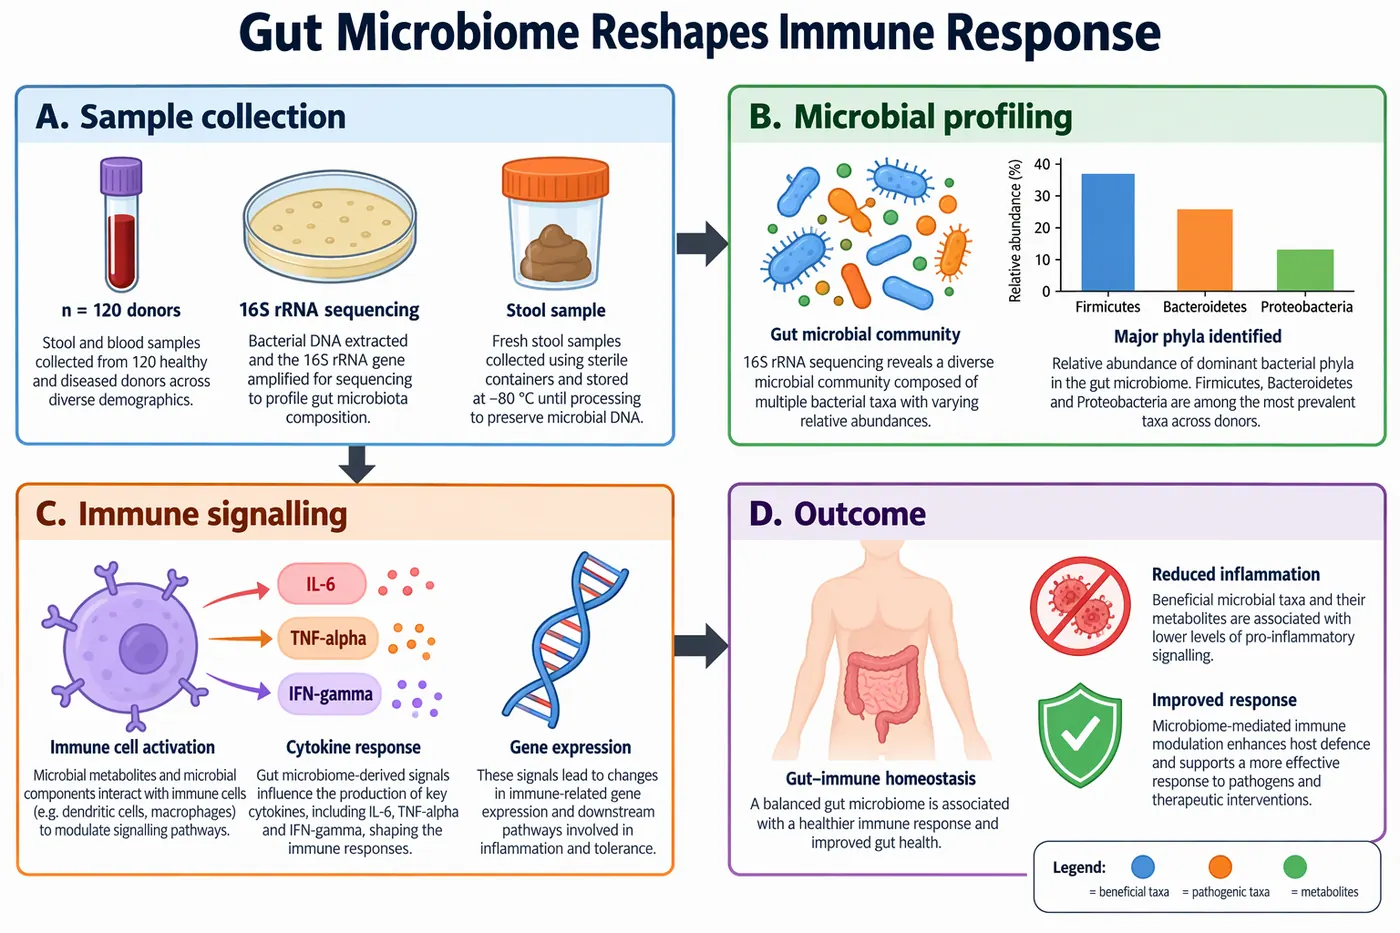
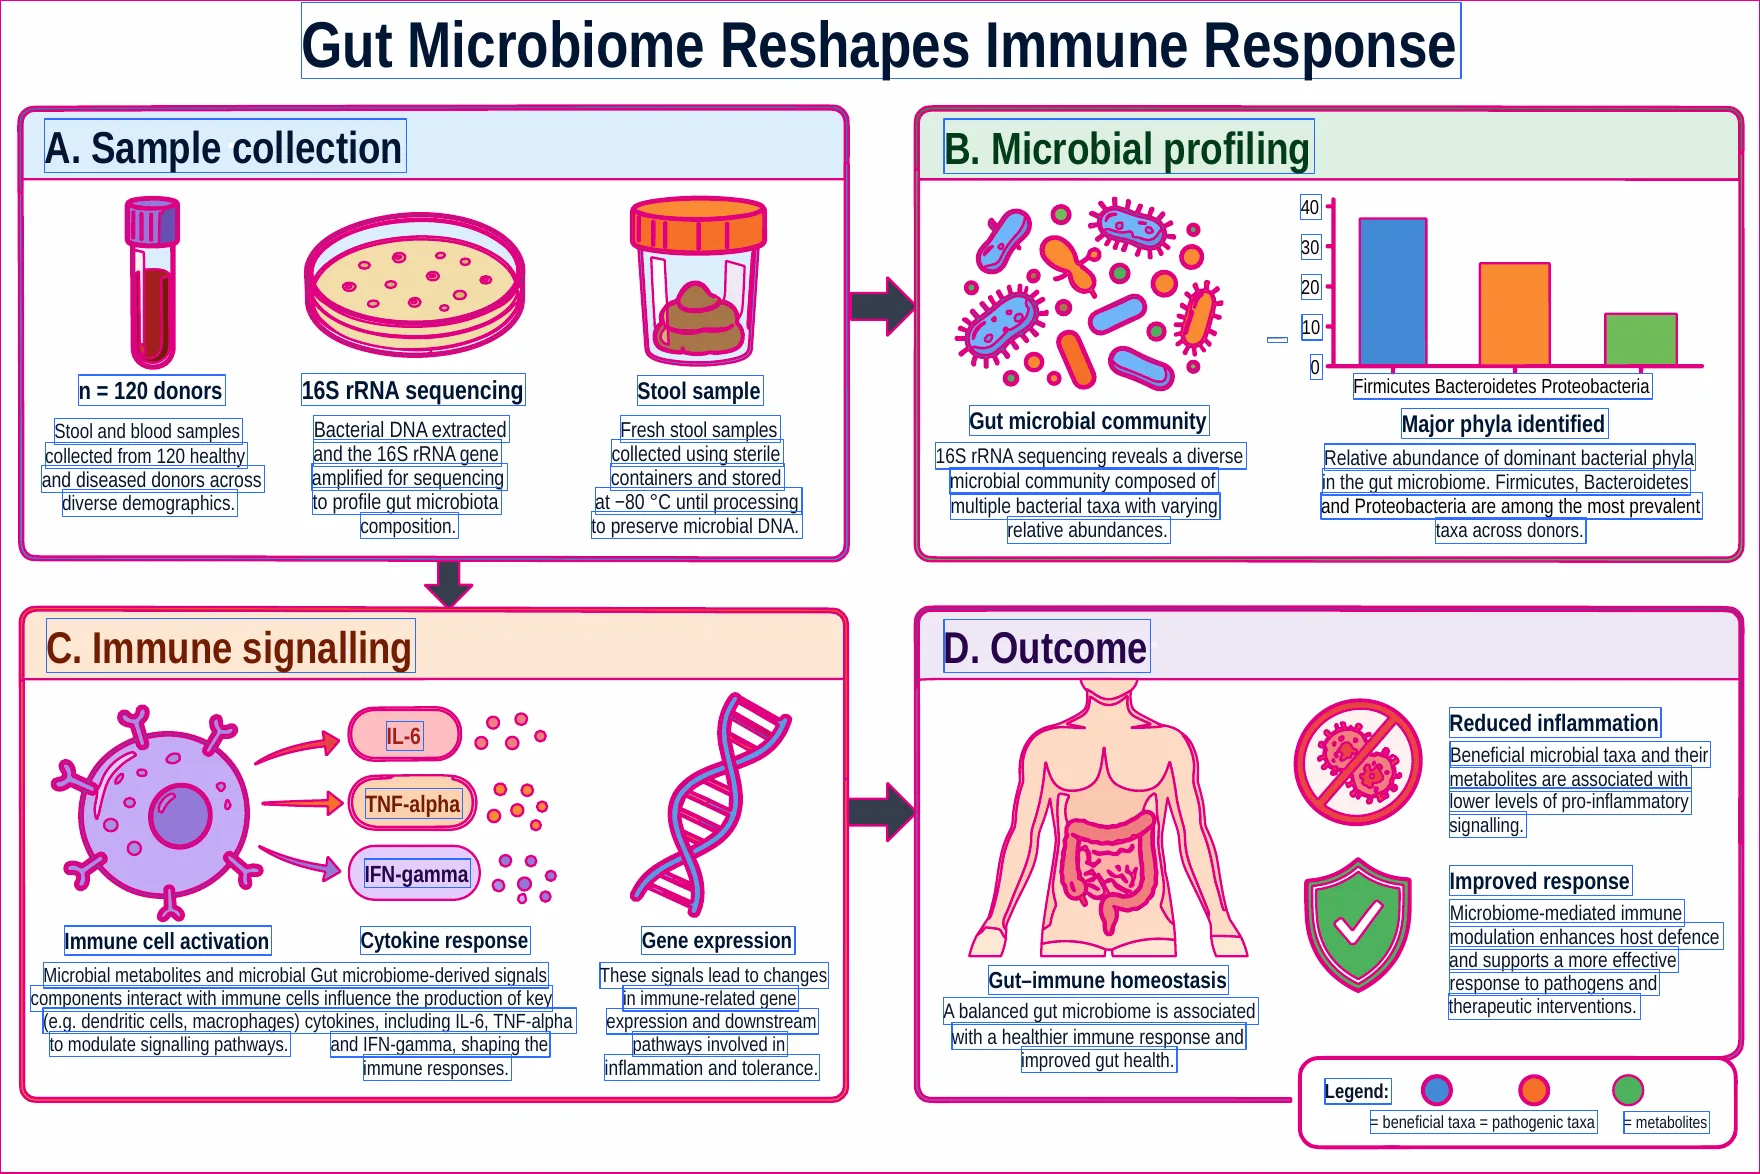
- Unraster: 74 text boxes, 298 vector shapes, 0 pictures. The bar chart, arrows, icons, cell and DNA are all shapes. Two defects: the rotated y-axis label "Relative abundance (%)" is in the file but its box collapsed to a sliver, so it does not show, and the x-axis labels are crowded.
- Codia: 43 text boxes, 5 shapes, 28 pictures. The bar chart is one 328 by 151 px picture, four panel pictures carry the artwork, and each icon is its own picture. No words were missing.
- Tosea: 53 text boxes, 0 shapes, a full-page background picture with the watermark inside it. About 34 words were left in the background picture and show as faint ghost text under the live text, and the axis value "40" was read as "401".
Test 2: a multi-chart data infographic
Bars, a pie, a line chart, three KPI cards and icons.



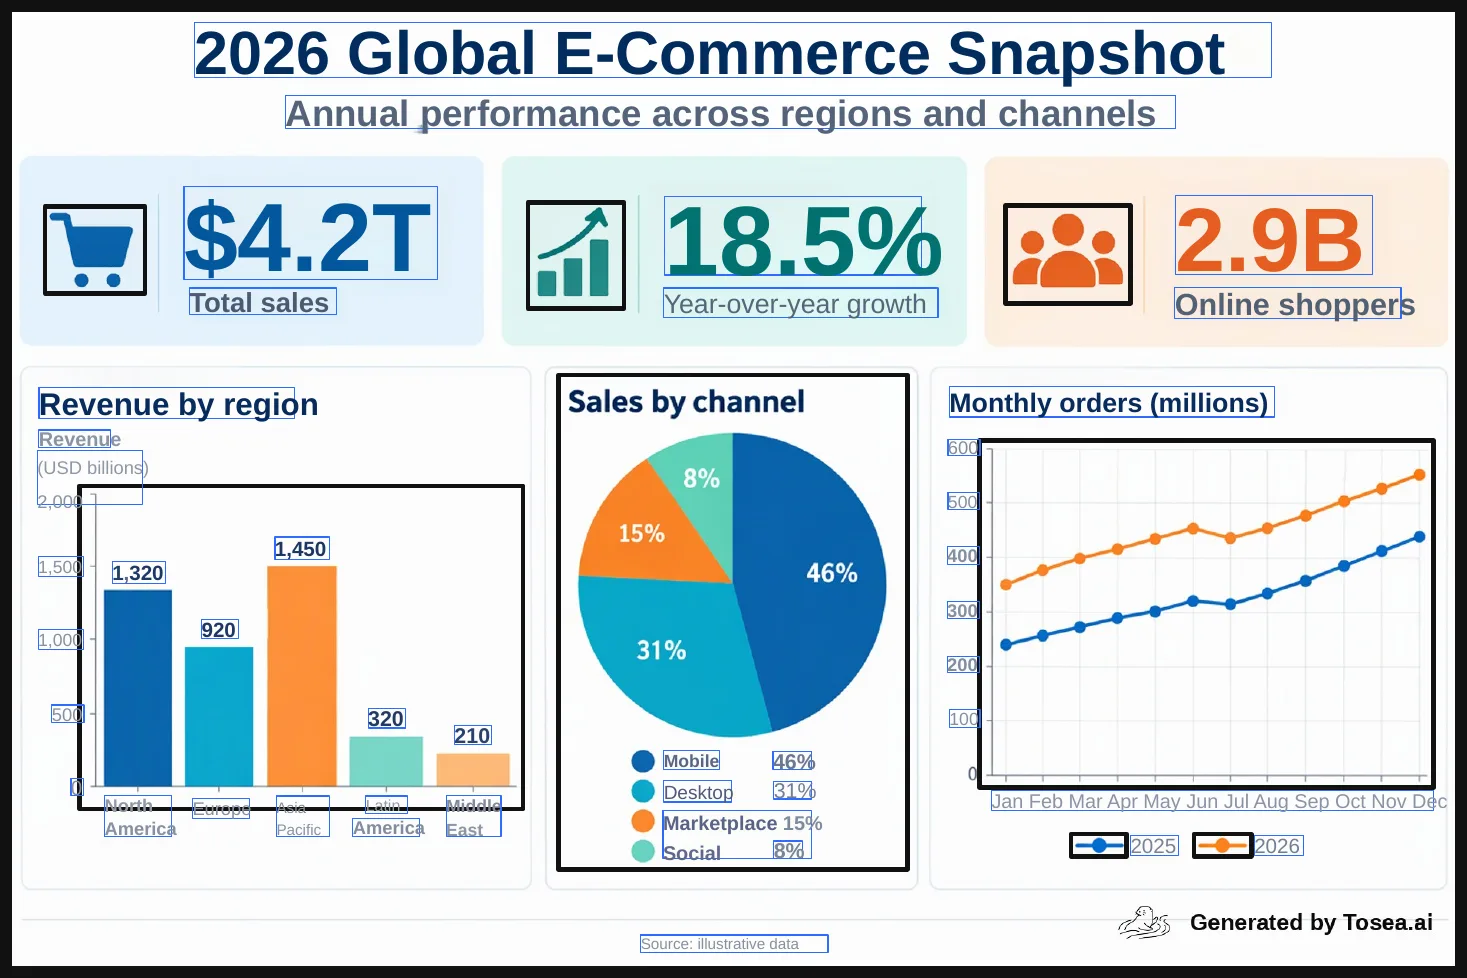
- Unraster: 54 text boxes and 88 vector shapes. Bars, pie wedges and the line with its markers are shapes, and the KPI numbers, bar values, pie labels and 12 month labels are text. Month labels are slightly tight.
- Codia: 51 text boxes and 11 shapes. The pie (321 by 321 px) and the line chart (473 by 367 px) are pictures. Three of the five bars are separate rectangles, but the other two, plus the axes and some faint ghost lettering, sit inside pictures behind them.
- Tosea: 43 text boxes, no shapes. Bars, pie, line and icons are inside the background picture or small pictures. The pie title "Sales by channel" and the four percentages are in the picture, not text.
Test 3: a multi-column infographic with numbered steps
Six steps, three icon blocks, tips and a script-font footer.
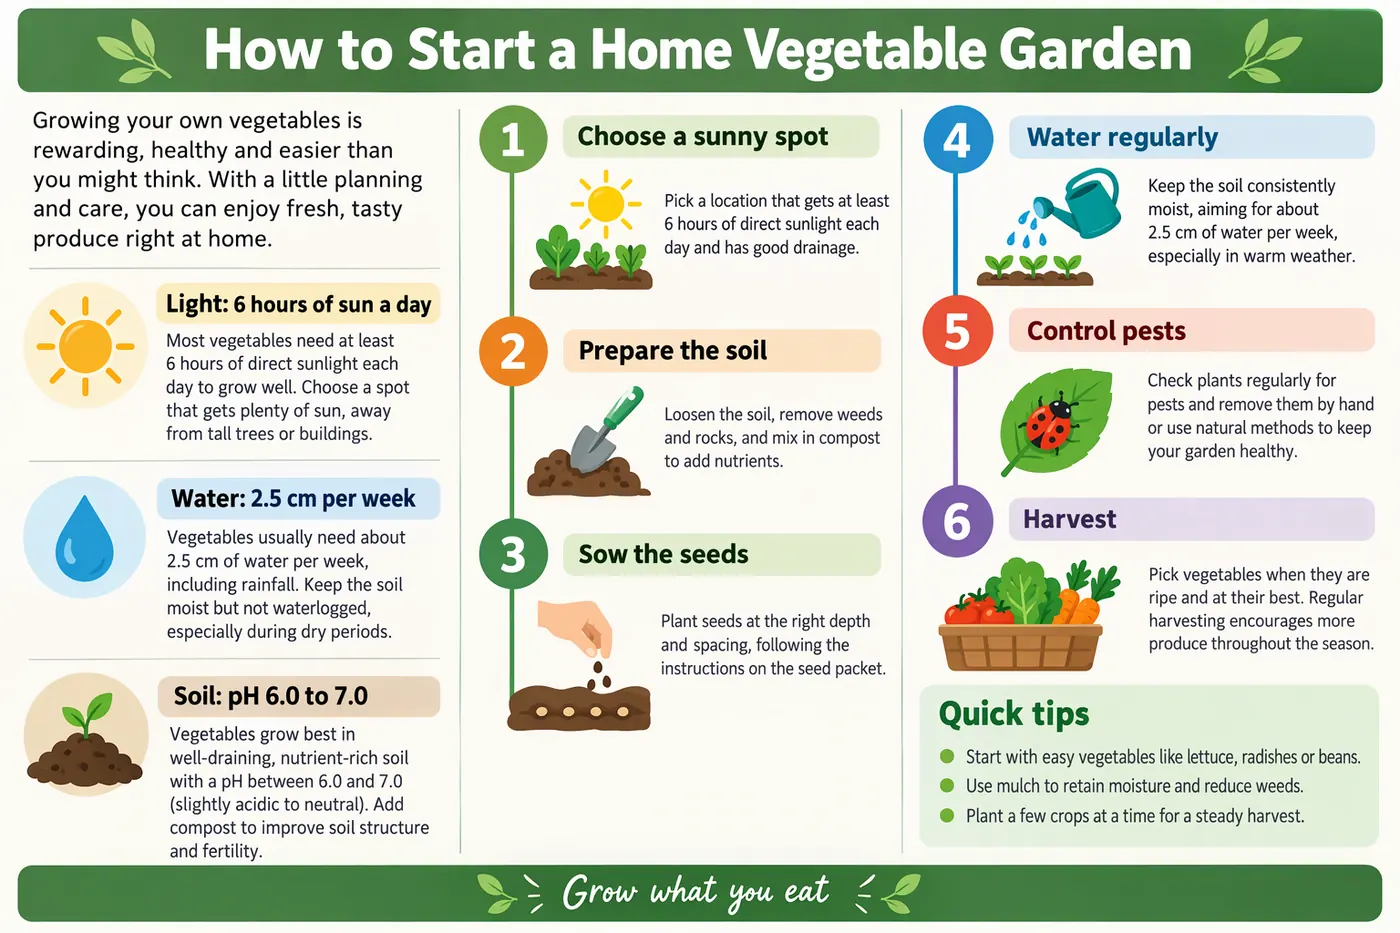
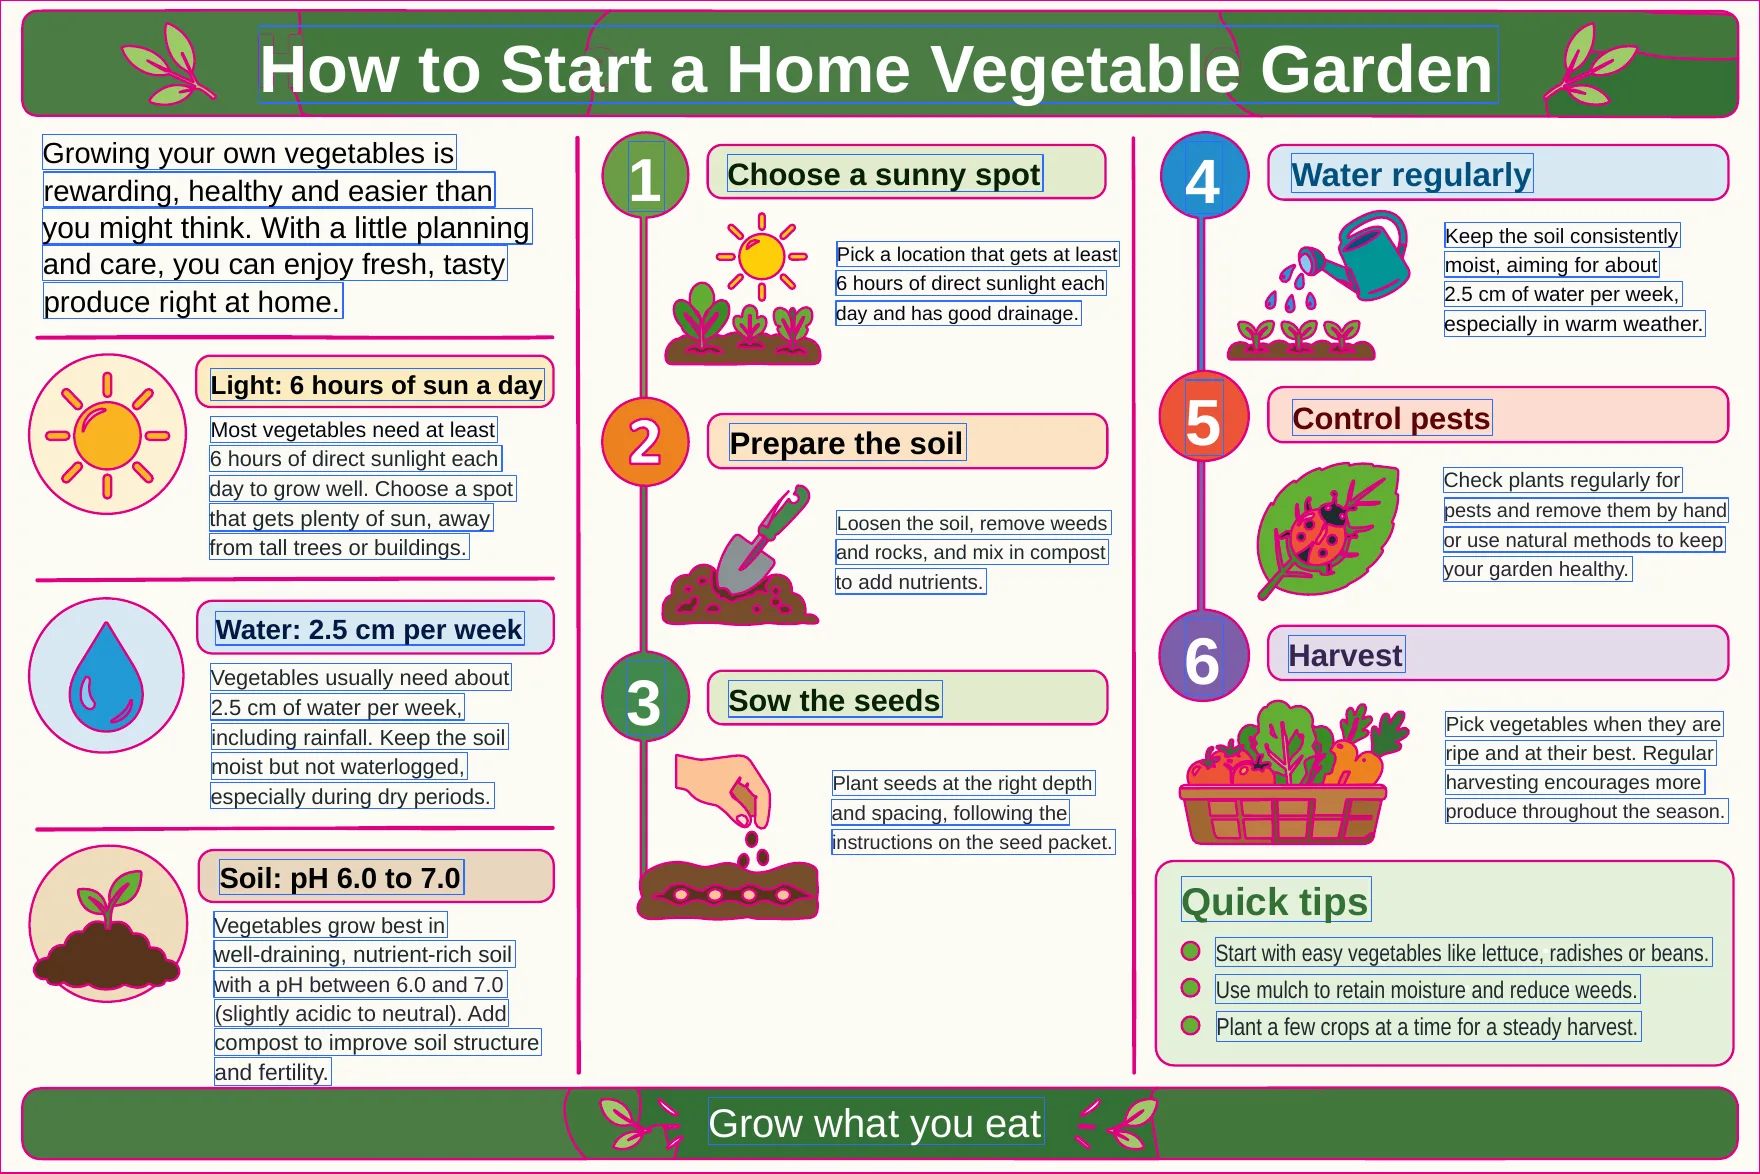
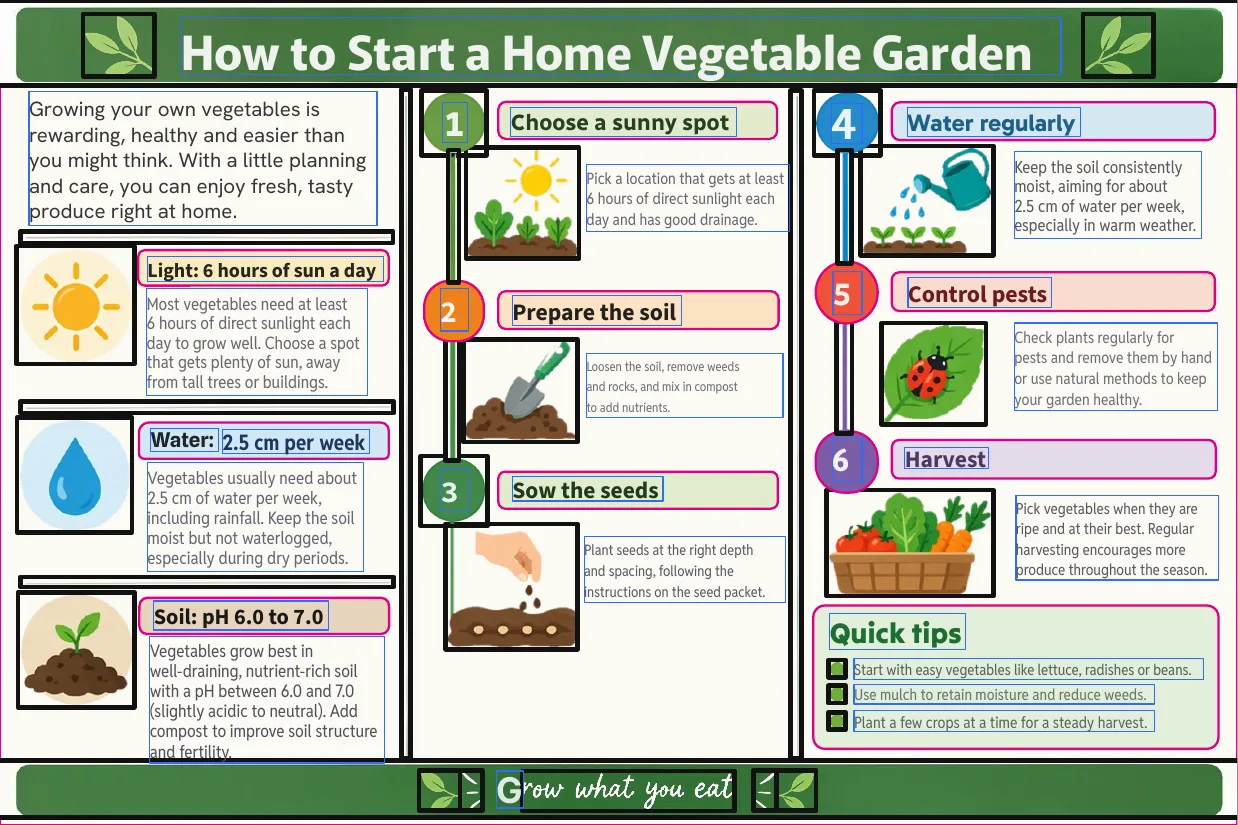
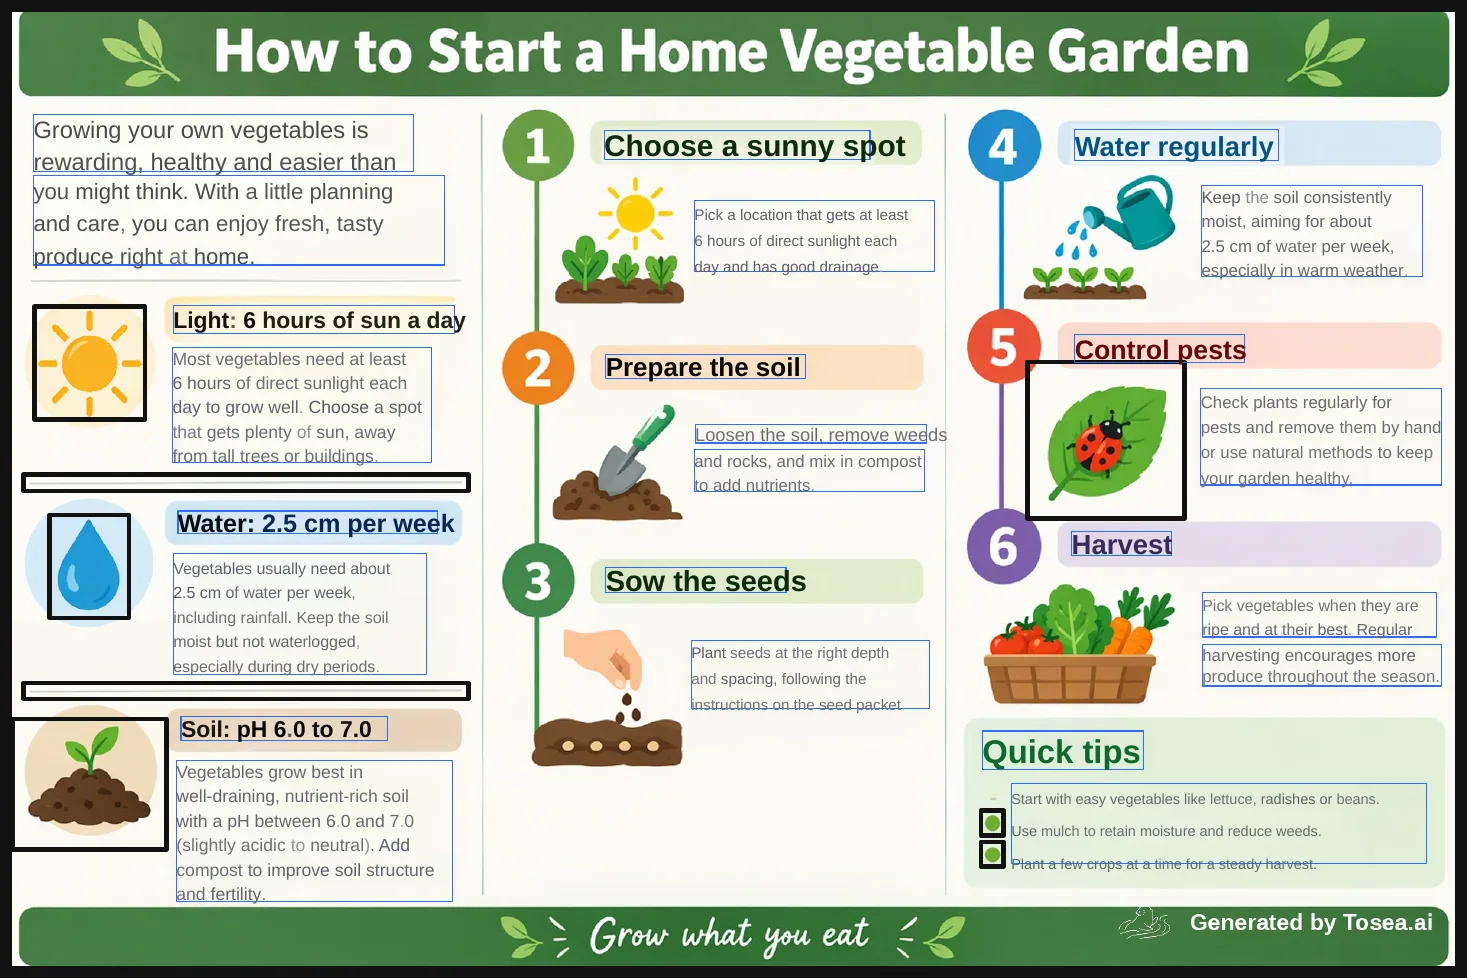
- Unraster: 62 text boxes, 222 vector shapes. The sun, drop, soil, trowel, ladybird and basket are redrawn as shapes with fine shading simplified. The header banner picked up some extra curved overlay shapes that are not in the original, and the script footer became plain text in a regular font.
- Codia: 32 text boxes (paragraphs merged into larger boxes), 14 shapes and 33 pictures. Icons and illustrations are separate pictures very close to the original. The script footer "Grow what you eat" is a picture, not text.
- Tosea: 24 text boxes, no shapes. The slide heading "How to Start a Home Vegetable Garden" is in the background picture, not text.
Editing the result: the files are not the same kind of "editable"
Counts say what is inside the file; the edits show what that means. We made the same edits in each product's own web editor and recorded the live pages in real time, no speed-up and no cuts: Unraster on the top half of each clip, Codia on the bottom. Tosea's free page only returns a downloaded .pptx with no editor, so it has no clip.

The short version: in Unraster each icon is a group of vector shapes that selects as one object, so you click it, drag it and recolour it. In Codia the icons are pictures: you can move them, but you cannot recolour them. The bar we selected in its editor behaved the same way, and shortening it did not move the label next to it.
Graphical abstract
Unraster: the shield (five shapes) selects as one group, drags and recolours as a unit. Because a group recolour is a single colour, the white check mark takes the same colour as the shield, so you would recolour the parts one at a time if you want it to keep its contrast. Codia: the shield is a picture; it drags but ends up behind the large body picture, and its picture toolbar has no fill colour.
Charts infographic
Unraster: the cart (three shapes) drags and recolours as a group; a bar and its "1,450" value label are grouped, so shortening the bar resizes both together. Codia: the cart is a picture and cannot be recoloured; the bar we selected offered picture tools only; it shortens, but its "1,450" label stays where it was. The exported file we counted can differ from what the editor showed, because Codia converted the image again before we recorded the clip.
Columns infographic
Unraster: the sun (ten shapes) drags and recolours as a group. Codia: the sun is a picture that drags but does not recolour.
Edits were made in Unraster's online editor on the free preview, so we only claim what the editor showed. To change one bar inside a chart, double-click into its group.
Try the same edit on your own figure. Upload it, see the free preview, and pay $2.99 (or 2 credits) only if you keep the file.
Limits of this test
Counts are on free tiers for Codia NoteSlide and Tosea and on the full unlocked file for Unraster, one run per image, so results vary with the image and over time. Unraster took 85 to 123 seconds with three images running at once; its flat vector redraw simplifies fine shading, and on the abstract it left a collapsed y-axis label and crowded x-axis labels. Always compare the result with your image and proofread numbers and names.
Which one to pick
| If you need | Pick |
|---|---|
| Icons, chart bars and columns you can drag and recolour | Unraster |
| To restyle a figure in your brand colours without redrawing it | Unraster |
| To move or rearrange icons and chart parts as separate objects | Unraster |
| A one-off vector-editable conversion with no subscription | Unraster ($2.99 or 2 credits per file; preview first) |
| Charts whose numbers stay editable as data | None of them; rebuild the chart in PowerPoint |
What it costs
Unraster shows a watermarked preview before you pay, free with Google sign-in (up to 3 a day). Unlocking a PowerPoint costs $2.99 or 2 credits per file, no subscription needed. Credits are only charged for a delivered file, and a failed conversion costs nothing. Prices change, so check the live pricing page.
How we tested
- Date and tools: 15 Nov 2026. Codia NoteSlide (codia.ai/noteslide/image-to-ppt) and Tosea (tosea.ai, its free image-to-editable-PPT tool; Tosea in this article always means that tool) on their free plans, one image at a time. Nothing was paid for on any tool.
- Unraster side: the production PowerPoint conversion job, run that day; it is the same conversion that produces the paid download. The output is the full unlocked file, not the free watermarked preview. That is an asymmetry: we ran our complete output against the competitors' free tiers.
- Images: three AI-generated test images at 1536 by 1024, four candidates each, one chosen per type. They are clean, text-correct renders; real screenshots and photos can behave differently.
- Counting: File contents read from slide 1. A text box is a shape with non-empty text; vector shapes are freeforms and autoshapes without text; pictures are image shapes. Text accuracy compares the exported text with an OCR baseline of the original, with tokens the OCR got wrong removed.
- Rendering: every file was rendered with LibreOffice, so the pictures here may differ from PowerPoint or a vendor's own editor. Layout-fidelity notes are our visual judgement.
- Heading letters: the Unraster shape counts leave out 14, 11 and 33 shapes that are outlines of bold heading letters (drawn from letter forms next to the live text). Counting them too, the totals are 312, 99 and 255; we use the lower figures so the comparison cannot be accused of padding.
- Grouping: the Unraster counts come from files exported before automatic icon grouping was added; grouping changes how shapes select in the editor, not how many shapes the file holds.
- Limits: one run per tool per image. Results vary with the image and over time, and competitor allowances change.
Try it on your own image
Upload the image, see the preview first, and pay only if you keep it. For $2.99 you get a file you can restyle, recolour and trim without redrawing anything. Convert an image to PowerPoint from $2.99 per file (the free preview shows the result first), see how to edit an infographic in PowerPoint, or compare more image-to-PowerPoint tools for what to fix by hand afterwards.