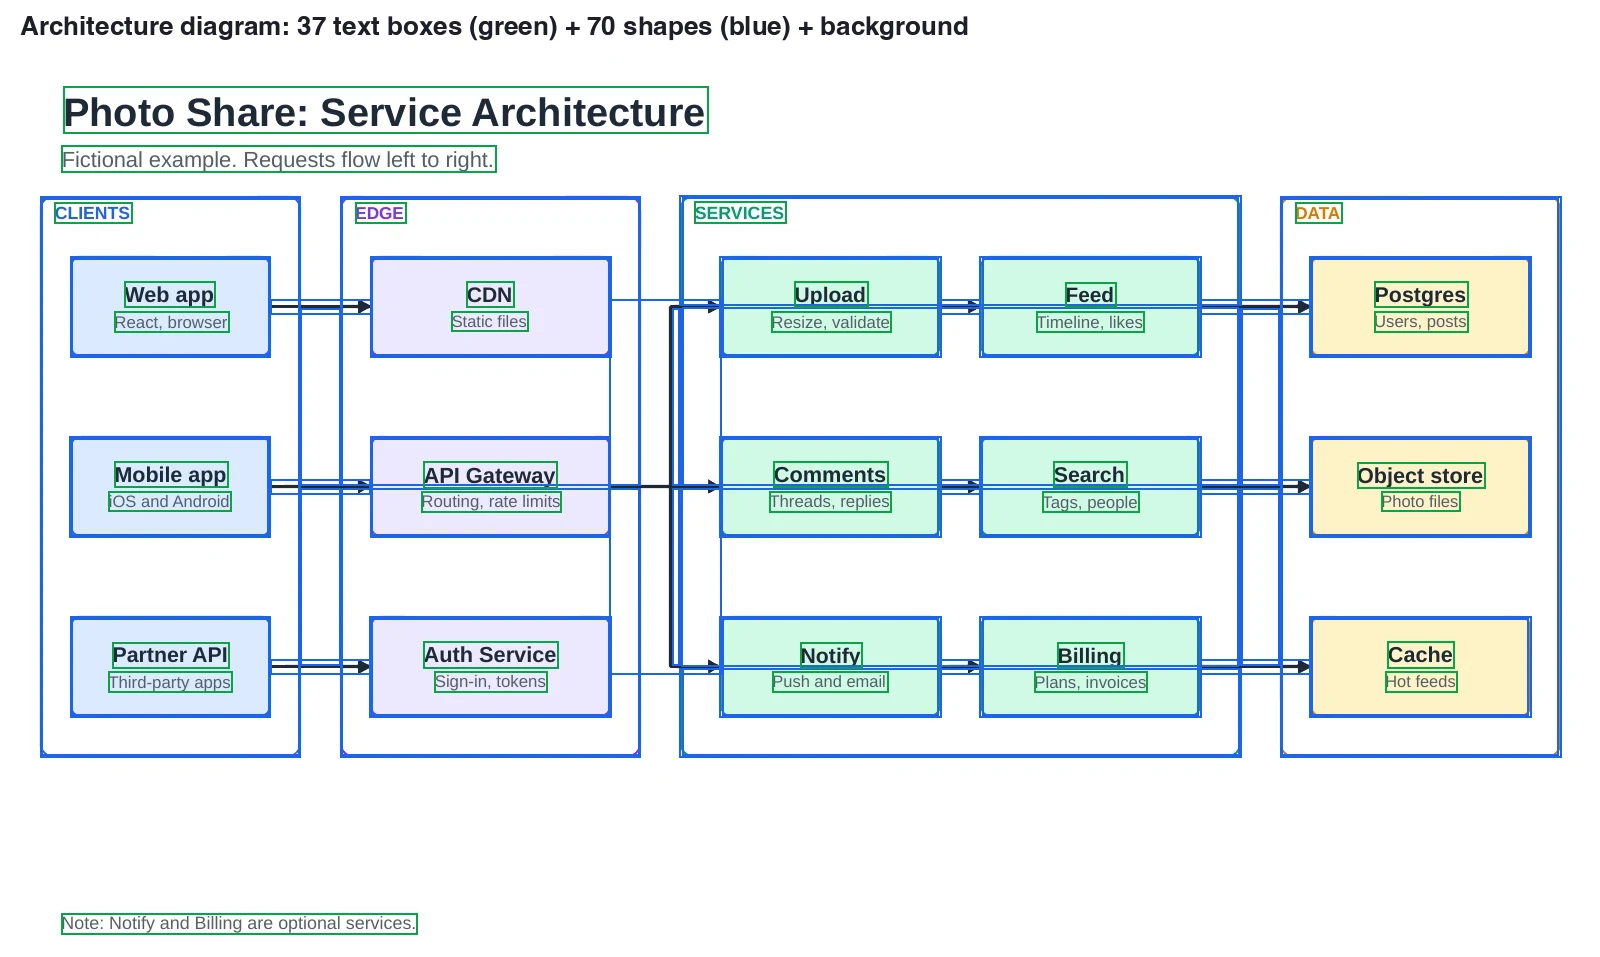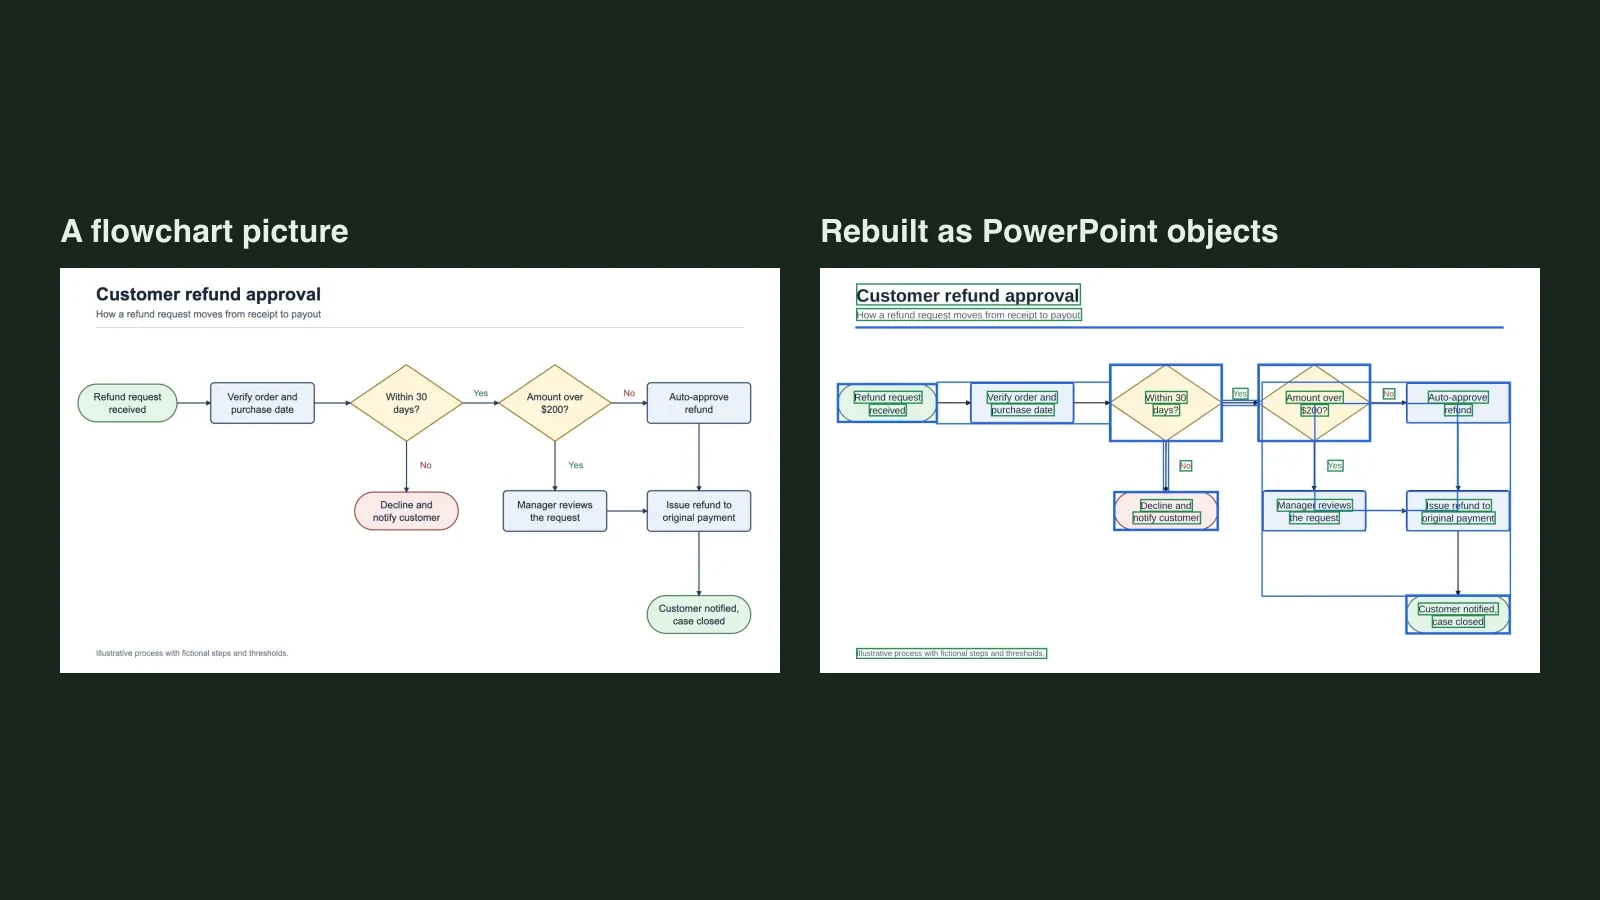
Quick answer: if the infographic is a PowerPoint template — SmartArt, grouped shapes or SVG icons — you edit it in place: click the piece, type, and use SmartArt's Text pane or the Group command on the Shape Format or Picture Format tab. If all you have is a PNG or JPG, PowerPoint cannot edit the words inside the pixels; you have to rebuild the infographic as text boxes and shapes first.
Infographics reach a deck in one of two forms, and they need opposite fixes. One is a set of PowerPoint objects someone grouped together; the other is a flat picture exported from a design tool or an AI model. The first is already editable. The second has no pieces to find.
First, decide which kind you have
Click the infographic once. If a frame appears around the whole thing and a second click selects one small shape or word, it is built from objects. If the whole area selects as a single rectangle and the Picture Format tab opens, it is a picture.
| What you see | What it is | Where to go |
|---|---|---|
| A frame with a text pane, and shapes that rearrange themselves | SmartArt | Edit SmartArt |
| One outer selection, then individual shapes on a second click | A group of shapes | Ungroup it |
| A small icon you can convert to shapes | An SVG icon | Convert to Shape |
| One rectangle, Picture Format tab, no text cursor | A PNG, JPG or WebP picture | Rebuild it |
Case 1: the infographic is already a PowerPoint template
This is the easy case. The words are real text and the boxes are real shapes, so nothing needs converting. You are only working around the grouping, the SmartArt layout or the icon format.
SmartArt: edit the text, then free the pieces
SmartArt is a layout engine. You type into its shapes, and it keeps them aligned and sized for you.
- Select the SmartArt frame.
- Use SmartArt's Text pane to enter and edit the text that appears in the graphic. As you add and edit content there, the graphic updates automatically.
- To create a new line of bulleted text in the Text pane, press Enter.
If you only need to reword it, stop there. To move one shape freely, duplicate the slide first, then break the graphic apart or ungroup it. In the Reset group, click Convert, then click Convert to Shapes; the graphic becomes ordinary shapes. After you split the SmartArt graphic into individual shapes, you can't convert the shapes back to SmartArt, so keep the duplicate if you may want the original layout back.
Grouped shapes and icons: click twice, then ungroup
A designer often groups an infographic so it moves as one object. That is why the first click selects everything.
- Click once for the group, then click again for the shape.
- Ungroup: select the group, then on the Shape Format or Picture Format tab, select Group and choose Ungroup. To group pieces again, hold Ctrl while you select them, then on the Shape Format or Picture Format tab, select Group and choose Group.
- Move versus resize: dragging a group is safe; resizing can scale shapes and text unevenly, so resize individual pieces when the layout must stay exact.
SVG icons need one extra step. An icon inserted with Insert > Icons is an SVG, not a group of shapes. Microsoft's guide to editing SVG images in Microsoft 365 has you right-click the image on the canvas and use Convert to Shape. Many SVG files, including Office icons, are single-colour, so converting to shapes is what lets you colour individual parts. You can't use the Group tool with SVG icons, so convert them to shapes first. After editing, you can group the pieces again in PowerPoint and Excel. On phones, colouring individual parts currently needs Office for Microsoft 365 on Windows.
Case 2: you only have a picture of the infographic
Now the infographic is one PNG, JPG or WebP — an export, a download or an AI-generated image. Click it and the whole thing selects as one rectangle. The words are coloured pixels, so there is no text cursor and no box to move.
PowerPoint's Edit Picture tool can make a small correction inside the picture. Microsoft's Edit pictures page lists Add text, Erase, Move, Upscale, Remove background, Auto enhance and Effects; the page does not say which versions include the tool, so check yours. Erase lets you brush over the area you want to remove, or draw a box around the object you want to edit, then select Erase to apply the removal. When you're done, select Update to save the changes and return to your slide. It is useful for one wrong date, not for restyling: the edited words are still pixels.
You can copy the words with OCR, redraw a few elements with Insert > Shapes, or rebuild the whole layout as PowerPoint objects; the rest of this guide covers the rebuild.
A real before and after
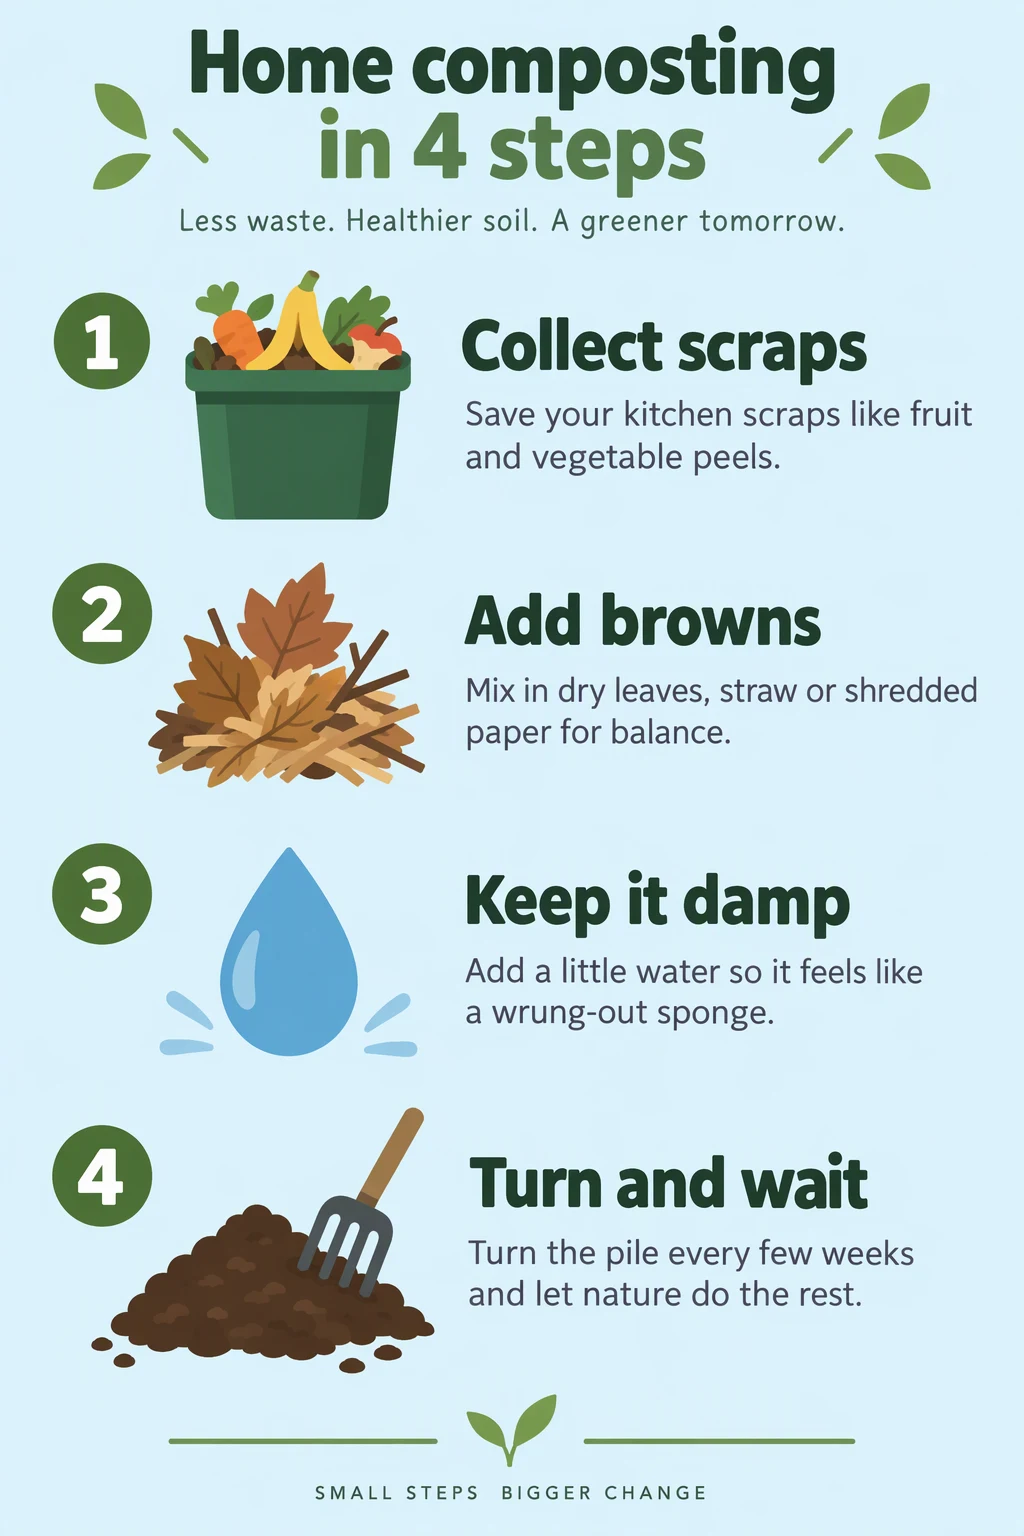
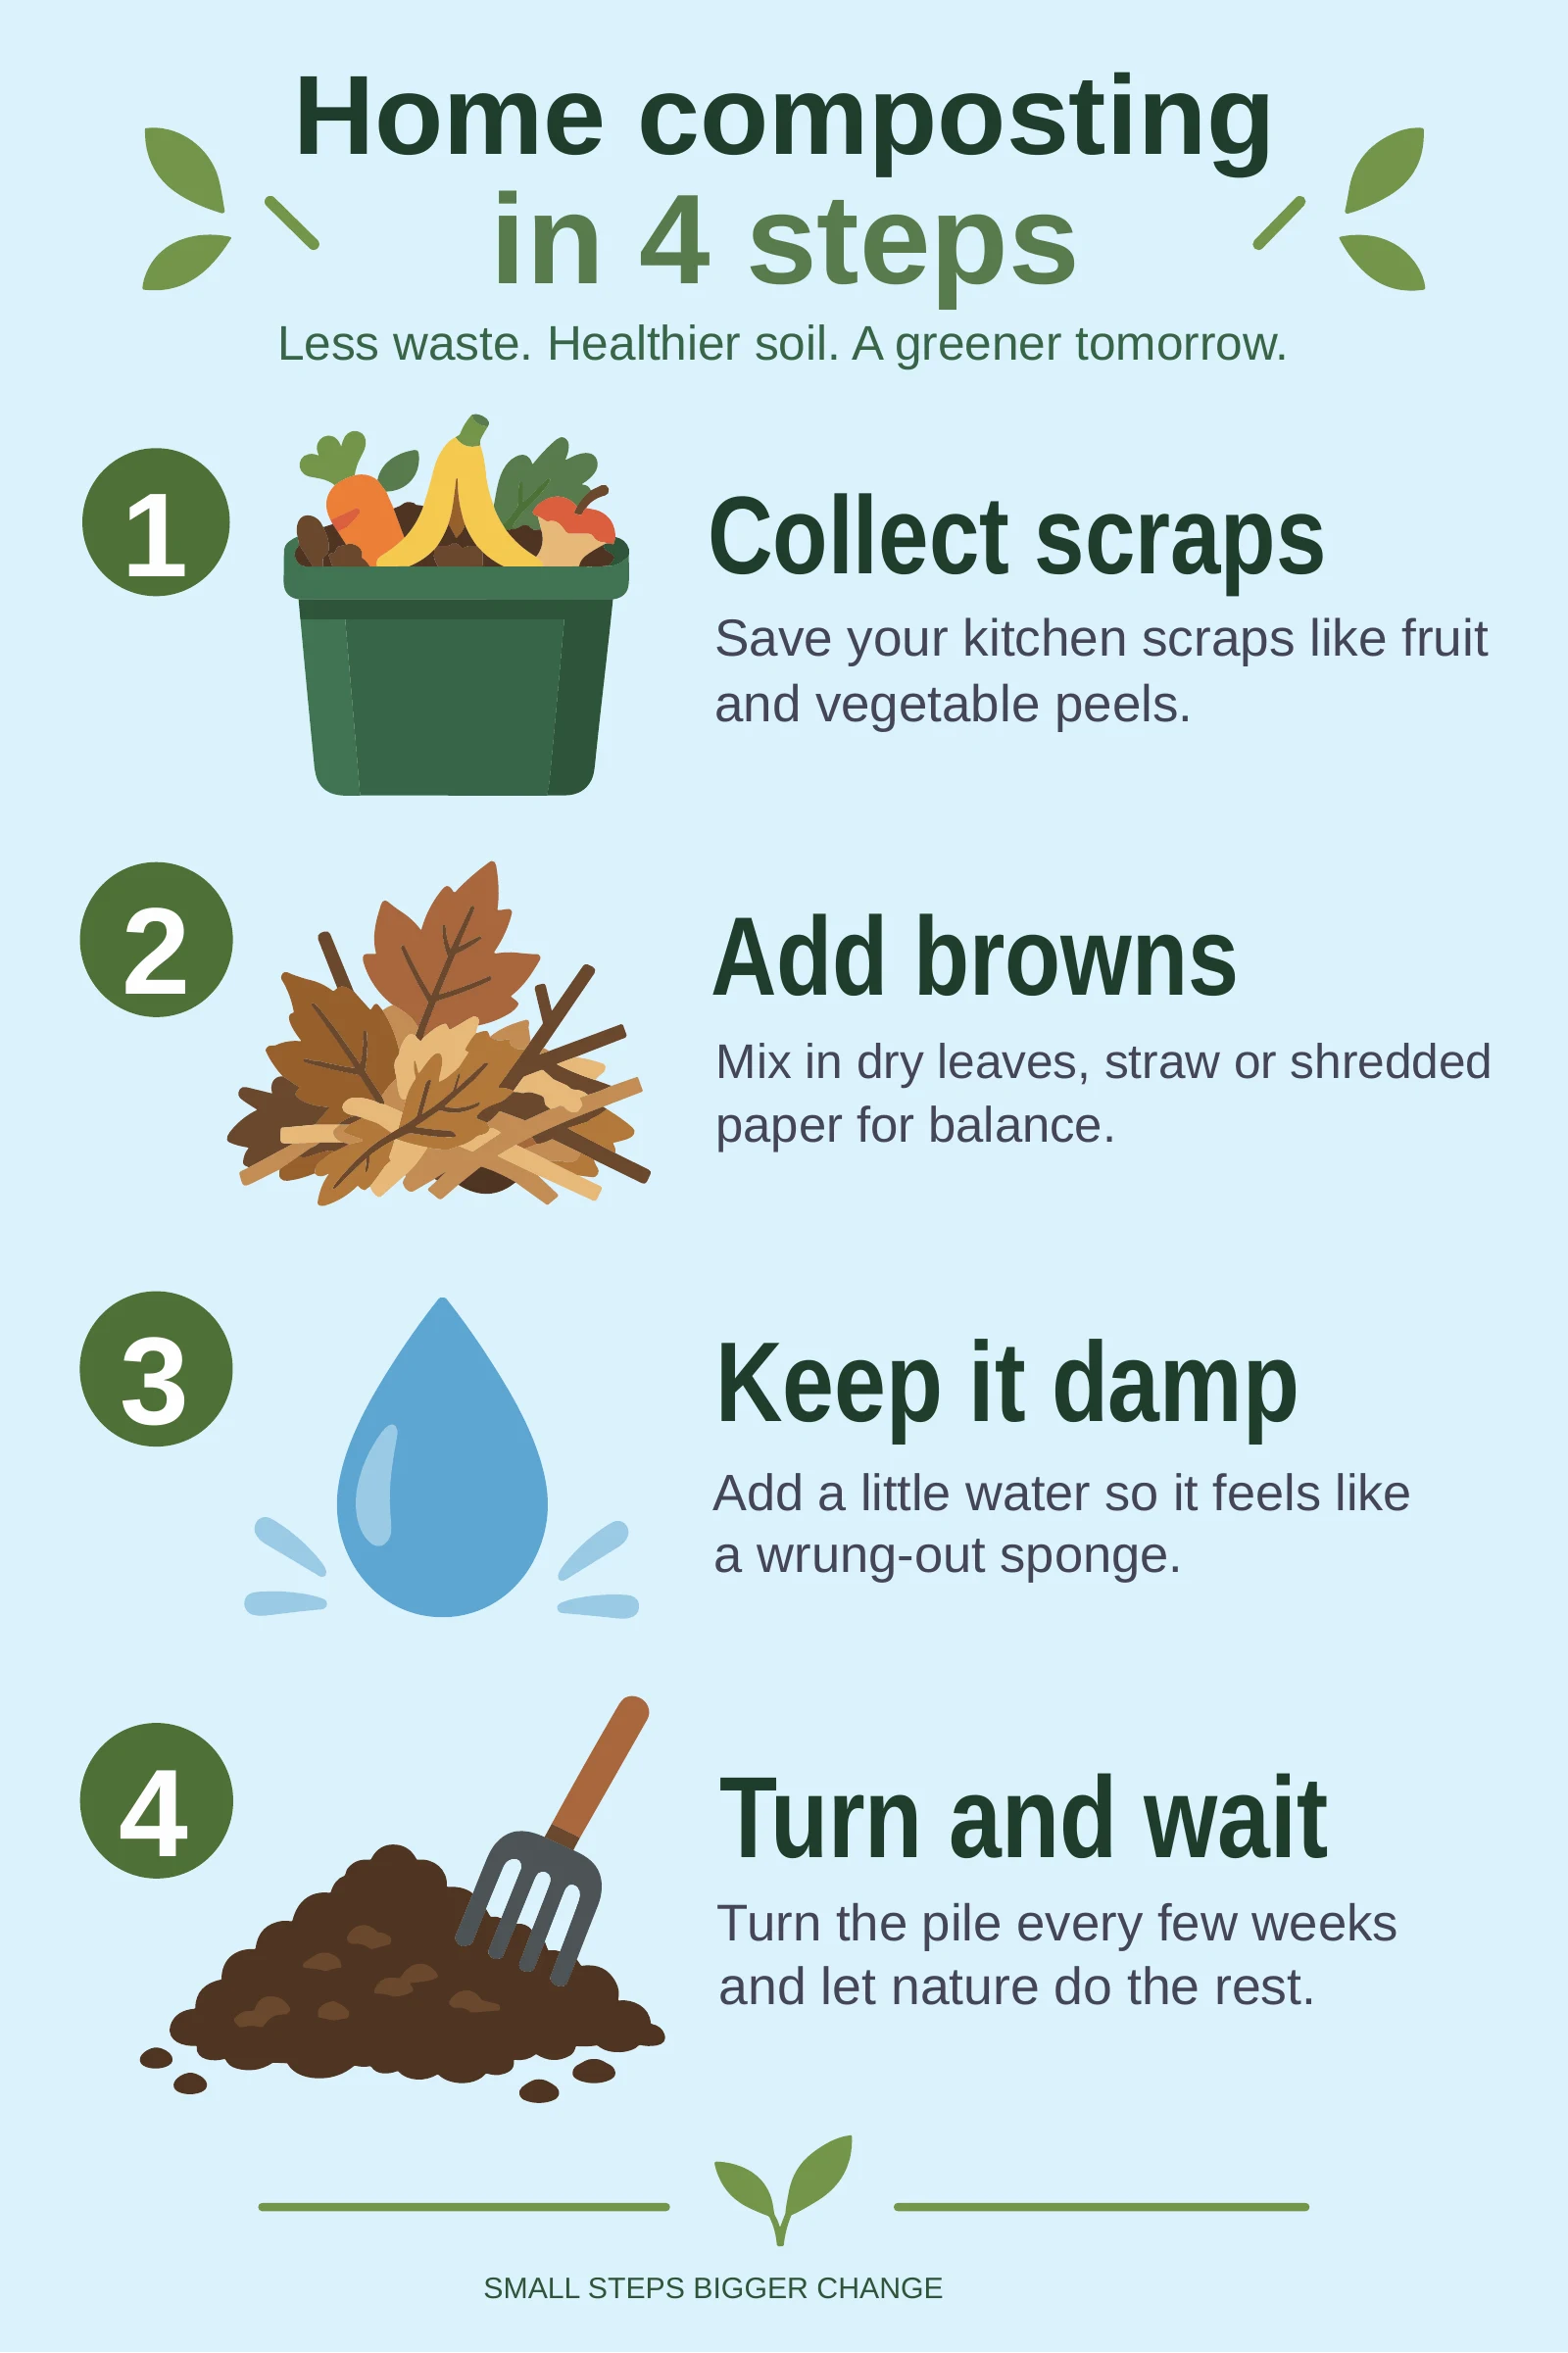
The source is a fictional “Home composting in 4 steps” infographic generated with OpenAI's image model: 1024 × 1536, portrait. It is a flat image, so none of its text is selectable.
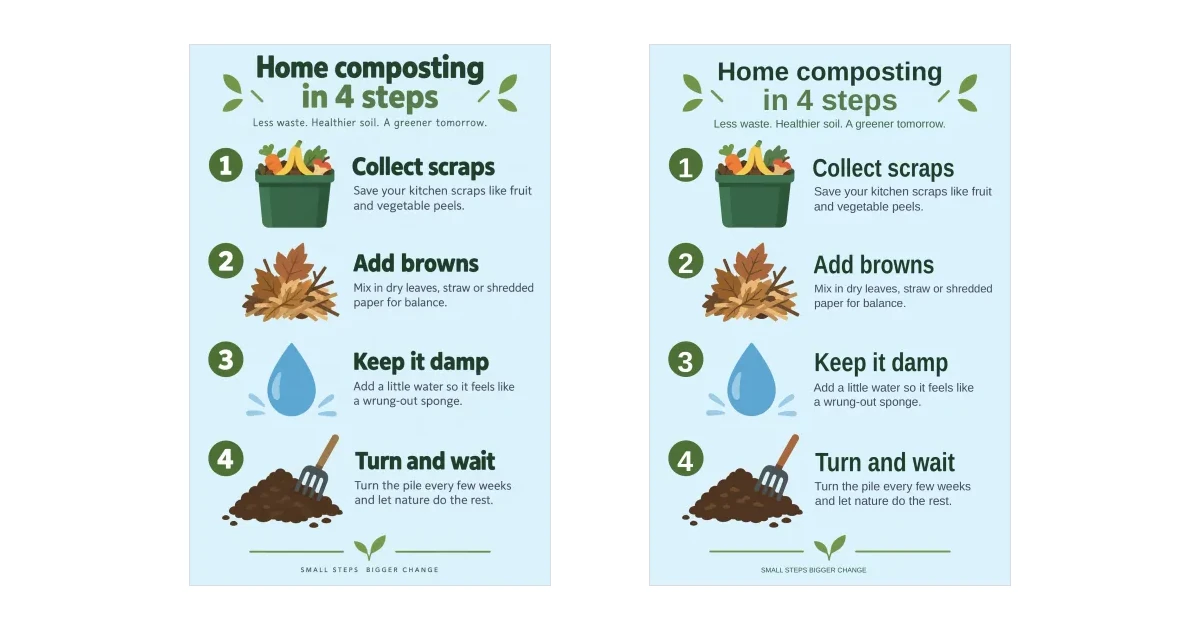
I ran it through the live conversion once. It cost 2 credits, and I made no manual fixes. The result is one 2:3 portrait slide. It contains 20 text boxes, with the rest as separate shapes and no embedded picture. The text boxes are the title split across two, the subtitle, four step headings, eight description lines (two per step), four number boxes and the footer. The words match the source word for word.
The differences that matter:
- Illustrations are simplified. The bin, leaves, water drop, soil pile and fork come back as flat shapes. Soft shadows and some small details are lost.
- Fonts and tracking are substituted. This file uses Arial and Arial Narrow, and the footer's wide letter spacing is gone, so the display type does not match exactly.
- Description lines are separate boxes. Each of the two lines in a step description is its own text box. If you rewrite a sentence, merge the lines or resize the boxes so nothing overlaps.
- Illustrations split into many shapes. Select the pieces of one icon and group them before you drag it, or you will leave half of it behind.
It is a rebuild to check, not a pixel-perfect copy.
How to convert an infographic image
- Open the infographic to editable PowerPoint page, choose your PNG, JPG or WebP, then click Make editable PowerPoint.
- Open the free preview: the page renders a lower-resolution, watermarked preview of the real PowerPoint, free with any account (up to 3 a day), with the text boxes and shapes you can edit.
- If it looks right, unlock and download the .pptx. Each file unlocks for $2.99 or 2 credits, and Download PPTX is free after unlock; the price is on the button before you pay.
- Open the file, replace the fonts, merge split description lines and group each icon's pieces; then compare it with the source at 100% and 200%.
A tall infographic may be easier in sections: one image becomes one slide, so crop it into readable blocks and upload each one.
What a rebuild cannot do
- No live charts or native tables. A rebuilt chart is shapes and text; a rebuilt table is boxes laid out like a table.
- No exact font match. Similar fonts are substituted, so line breaks and spacing shift.
- No guarantee on tiny text. Very small captions can be misread or remain as shapes. Proofread numbers, dates and names.
- No preserved effects, and no pixel-perfect copy. Gradients, shadows and texture are simplified, so compare the result with the source before you present it.
Related reading: how to convert a picture to shapes in PowerPoint covers Convert to Shape and redrawing by hand, and can ChatGPT make editable PowerPoint slides shows what happens to AI-generated infographic images.
Bottom line: if the infographic is SmartArt, grouped shapes or SVG icons, it is already editable: use SmartArt's Text pane, ungroup it, or convert the icon. If it is a flat PNG or JPG, PowerPoint has no text to edit. Redraw a few elements by hand, or convert an infographic image to editable PowerPoint when the layout is dense, then check fonts, split lines and artwork.