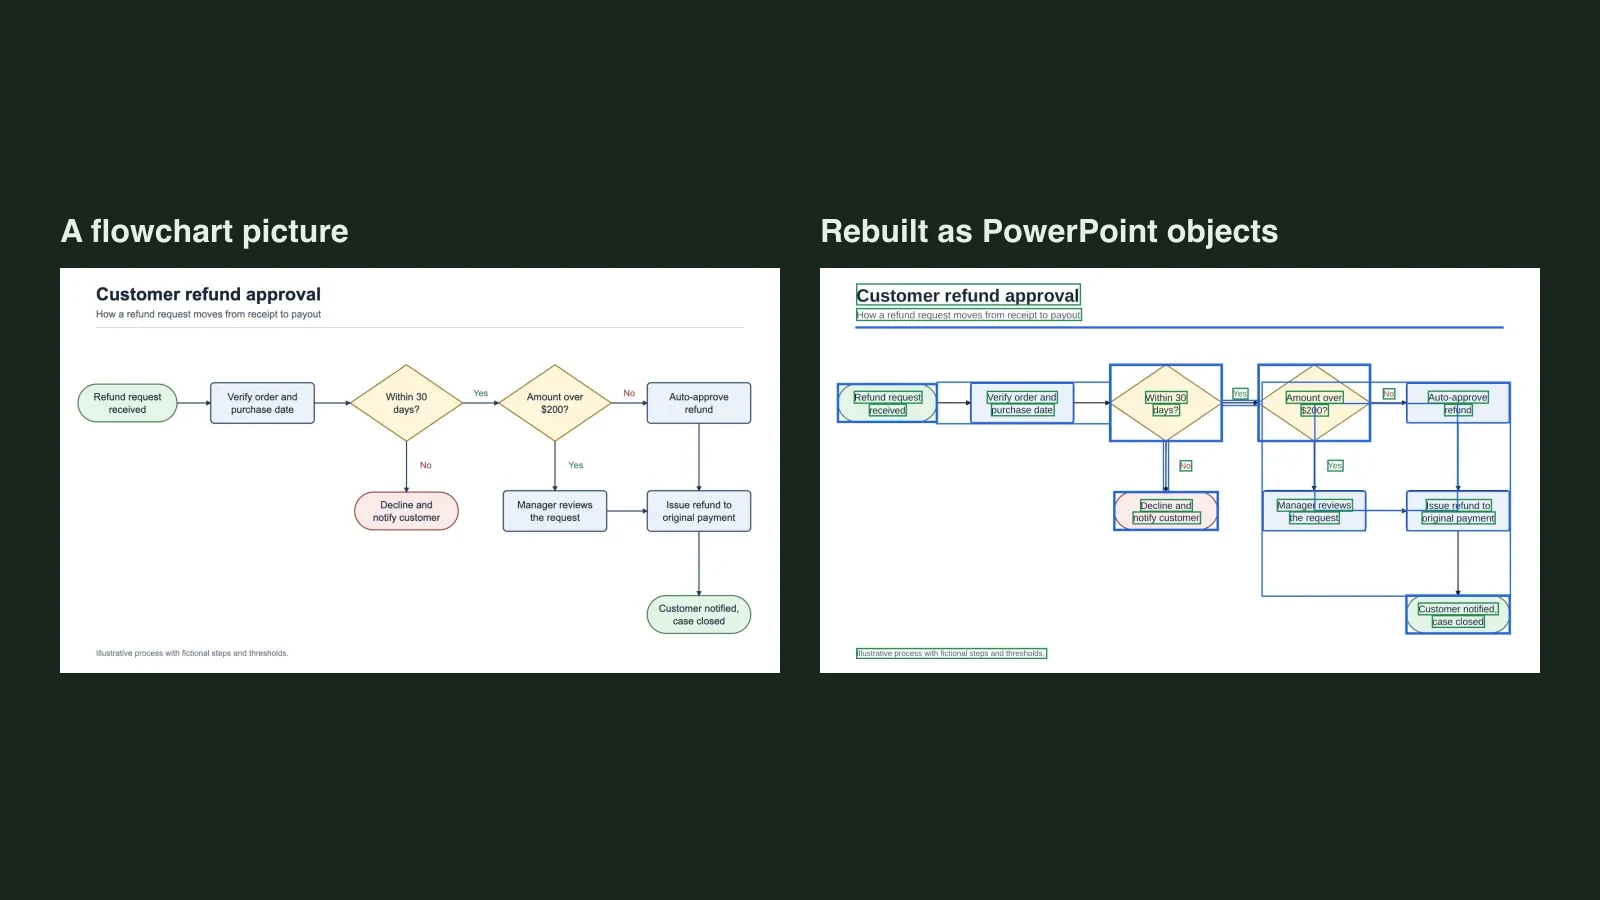
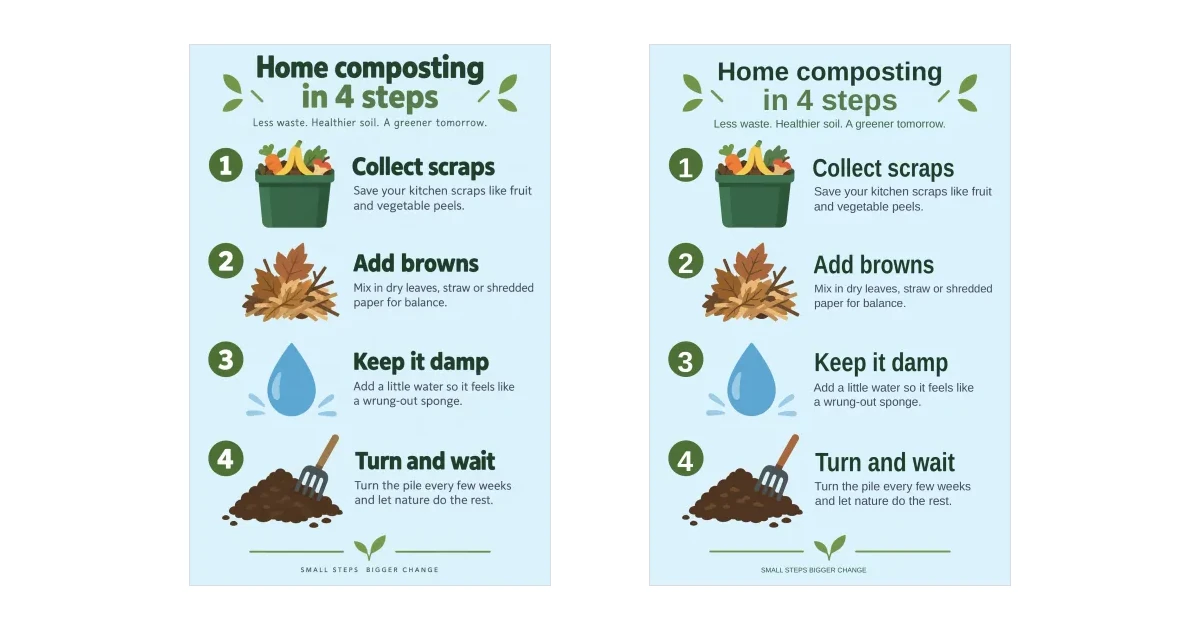
Quick answer: PowerPoint's Convert to Shape works on SVG graphics (vector files), not on PNG or JPG pictures. A flat picture cannot be turned into shapes with one click. To get separate shapes and text boxes from a PNG, a chart or a diagram, you either redraw it by hand or rebuild it with a converter such as Unraster. Both are covered below.
You pasted a PNG of a chart or a flowchart into PowerPoint, clicked it, and the whole thing selected as one rectangle. You went looking for a "convert to shapes" button. For a picture, there is not one. This guide says exactly where the built-in command stops, what to do from there, and what a rebuilt slide looks like when you open it.
Pick your row first.
| What you have | Best route | What you end up with |
|---|---|---|
| An SVG file or an icon | Convert to Shape | Separate vector shapes |
| A PNG or JPG with about 5 boxes or fewer | Redraw it by hand | Native shapes you drew yourself |
| A dense diagram, flowchart or slide screenshot | Rebuild it as objects | Separate text boxes and shapes |
| A chart image whose bars you need to restyle | Rebuild a chart image | A drawing of the chart (no data sheet) |
| A chart whose numbers will change | Insert > Chart, picture as a guide | A live chart with a data sheet |
| A photo you want in a circle or rounded frame | Crop to Shape | Still one picture, just a different outline |
For the wider set of options, including Edit Picture and OCR, see how to make an image editable in PowerPoint.
What Convert to Shape does in PowerPoint
Microsoft's guide to editing SVG images in Microsoft 365 (read on 2026-11-08) describes Convert to Shape in its section on SVG files. Its steps are to right-click the image on the canvas, choose Convert to Shape, then select one piece of the image and edit it with the Shape Format tab, repeating for each piece you want to change. In PowerPoint and Excel you can then Ctrl+click the pieces and use Group to join them again as one object.
Three details matter for your question:
- It is written for SVG. The page notes that many SVG files, including Office icons, are single-colour images. It does not mention PNG, JPG or any other picture format, so do not expect a right-click on a screenshot to offer it.
- It splits what is already shapes. An SVG stores paths, so there is something to separate. A PNG stores a grid of coloured pixels, with no boxes or words inside to find.
- Phones have a limit. The page says that on iOS and Android you currently need to open the document in Office for Microsoft 365 on Windows for the colour-by-part editing.
If your source is an SVG, use this command and stop reading. If it is a picture, the sections below are for you. Microsoft's guide does not describe any route from a PNG or JPG to separate shapes, so I have not listed one here.
Related: if you have a PNG and want an SVG first, how to convert a PNG to SVG covers that, but a traced SVG is outlines of coloured regions, not boxes and text boxes, so it is not the same as a rebuilt slide.
Crop to Shape is not conversion
Many pages on this topic are about Crop to Shape, which clips a picture to an outline such as a circle or rounded rectangle. The picture is still one picture, so this fits a headshot or a photo frame and does nothing for a chart or a flowchart. If that is what you need, use PowerPoint's Crop tool and you are done. If you need the contents of the picture to be separate objects, keep going.
Redraw it by hand
For a slide with a few elements, redrawing is quick and gives you full control.
- Put the picture on a blank slide as a guide, then lock or send it to the back.
- Draw boxes, diamonds and arrows with Insert > Shapes. For flowcharts, use connector lines so arrows follow the boxes when you move them.
- Add text with Insert > Text Box, or type straight into a shape.
- Build one box with the right fill, outline and font, copy it, and use Format Painter to carry a style across.
- Select rows of objects and use Align and Distribute.
- Delete the guide picture and group finished sections.
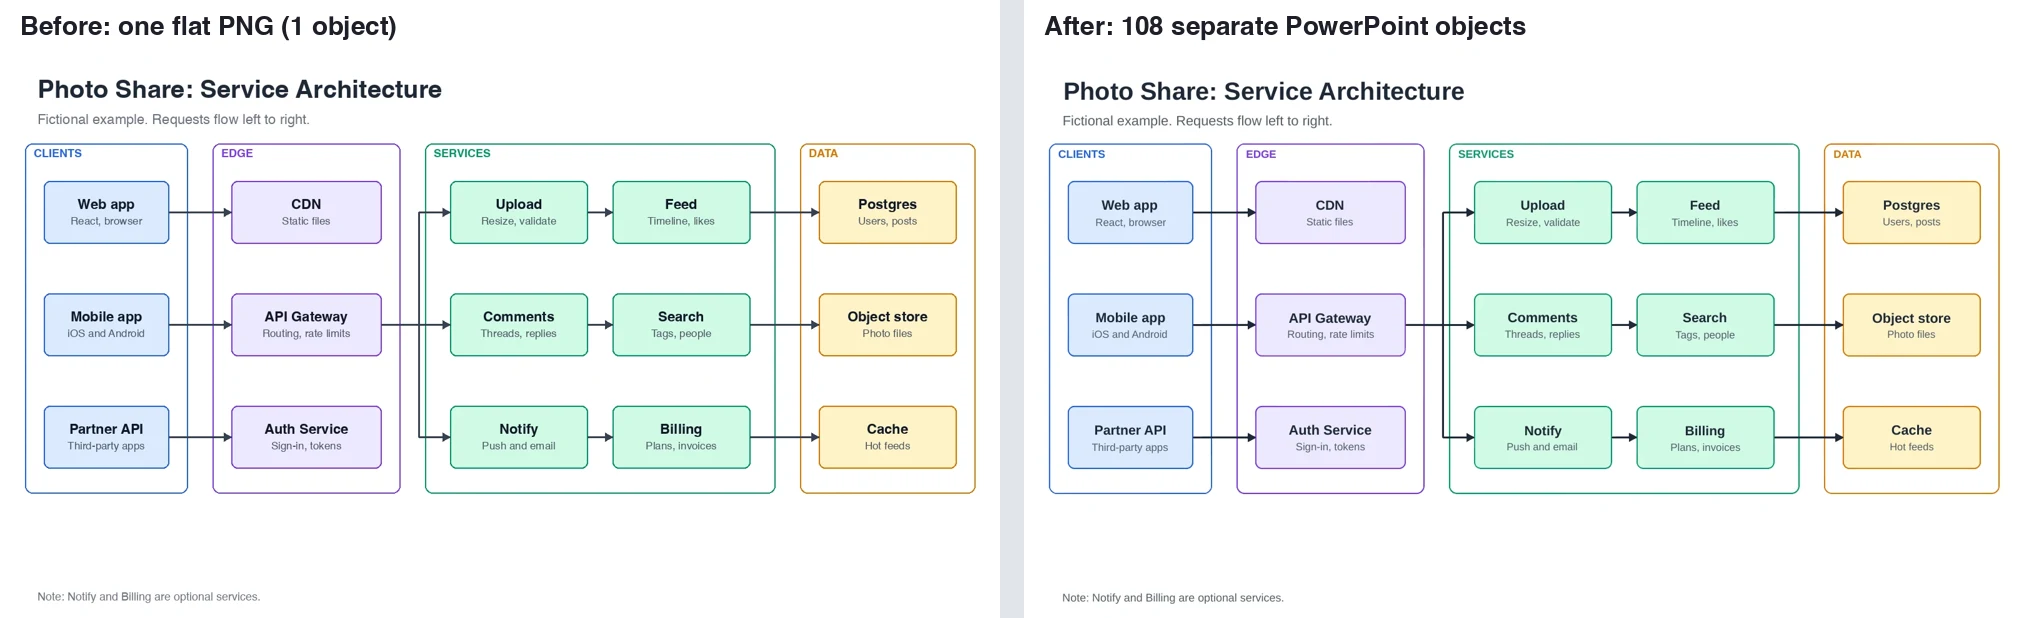
It gets slow on dense material. The architecture diagram below has 15 labelled boxes, 4 panels and a web of arrows; redrawing it is a long job and the first place automatic rebuilding earns its cost.
Rebuild a picture as separate shapes with Unraster
Unraster takes one PNG, JPG or WebP and rebuilds the whole image as a PowerPoint slide: the words come back as text boxes, and boxes, lines, bars and fills come back as separate shapes. You download a .pptx file and edit it like any other slide.
- Choose the image on the image to editable PPT page and click Make editable PowerPoint.
- Open the free preview: the page renders a lower-resolution, watermarked preview of the finished file, free with any account (up to 3 a day), so you can retype text and drag objects.
- If it looks right, unlock and download the .pptx for $2.99 or 2 credits. Download PPTX is free after unlock, your edits are kept, and the price is on the button before you click.
Here is one real conversion. The source is a fictional "Photo Share" service architecture I drew as a PNG; the result was rendered from the finished .pptx.
What is actually inside the file
I unzipped the result and counted. This single measurement of one sample, the architecture diagram, found one 16:9 slide made only of separate objects: 37 text boxes (title, subtitle, 4 layer labels, 15 names, 15 captions and a footer note) and the rest as shapes, which includes the background. It has no embedded picture, and nothing is grouped.
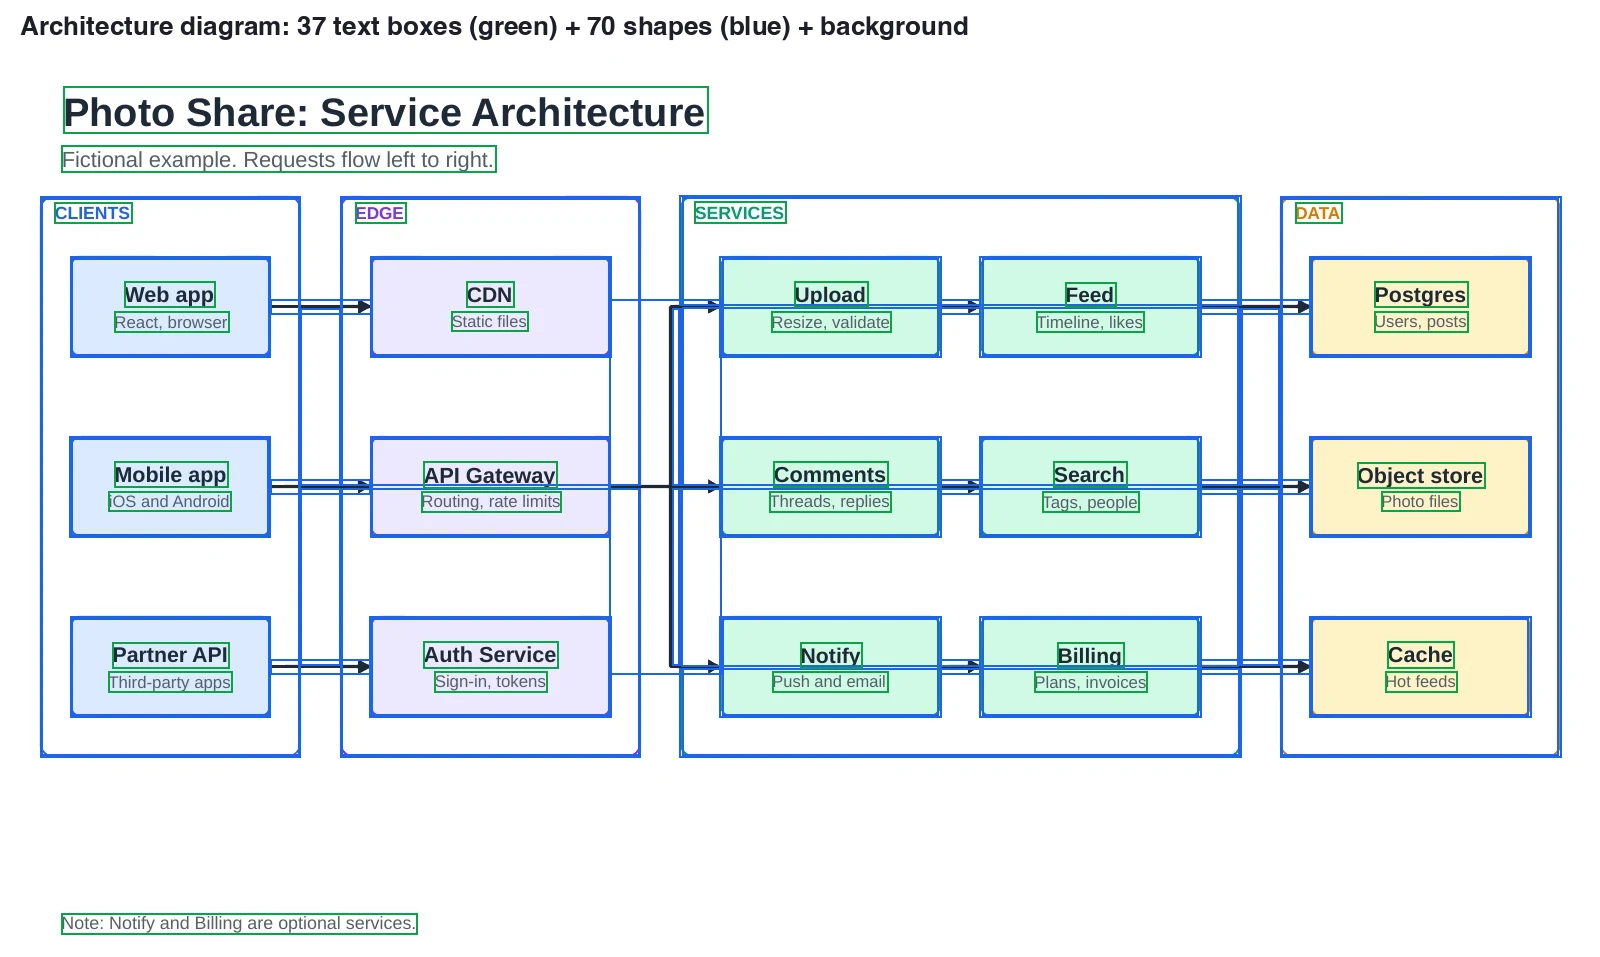
What to check: the arrows are separate line and arrowhead shapes, not connectors, so moving a box leaves its arrow behind. Labels of the same role came out at slightly different sizes (captions between about 12.3 and 13.4 pt, names between about 15.6 and 16.3 pt), so select a row and set one size.

A chart image to shapes
Charts are the question people ask most, and the one where expectations go wrong. A chart image rebuilt this way becomes a drawing of a chart: bars, lines, axis labels and legend are separate objects you can move, but nothing links them to a data sheet. You can recolour a bar, retype a label or move the legend; you cannot type a new number and watch the bar resize.
For a graph whose data will change, the better path is a real chart: choose Insert > Chart, type the values from the picture, and style it to match. Use the rebuilt slide only when the chart is final and you want to restyle or annotate it.
Which method for which picture
| Situation | Redraw | Rebuild with Unraster | Convert to Shape |
|---|---|---|---|
| SVG or icon file | Not needed | Not needed | Yes |
| About 5 boxes or fewer, no hurry | Yes, quick | Optional | No |
| More than about 5 boxes, many labels | Slow | Yes | No |
| Flowchart you will reword | Yes, with connectors | Yes, then redraw arrows | No |
| Chart you need to restyle | Slow | Yes, as a drawing | No |
| Chart with changing numbers | Use Insert > Chart instead | No | No |
| Photo | Crop it as a picture, no conversion | No | No |
What Unraster can't do
- No native charts or tables. You get shapes and text only. A rebuilt chart has no data sheet, and a rebuilt table is boxes laid out like a table.
- Fonts are replaced. Similar fonts are used, so spacing shifts slightly and a brand typeface will not match.
- Small text can be misread. Very small lettering can be recognised wrongly or stay as a shape. Proofread names, dates and numbers.
- Gradients and effects flatten. Gradients come back as flat or simplified fills and decorative shading can be lost.
- Arrows are not connectors. They are drawn shapes that will not follow a box when you drag it.
- Not a pixel-perfect copy. It is a close rebuild that you should compare with the source before you present.
The architecture sample above is a single run; I have not measured a larger set, so treat its object count as an example, not an average. If a conversion fails, no credits are charged.
A practical order of attack
- If the file is an SVG, use Convert to Shape.
- If it is a picture with about 5 boxes or fewer, redraw it.
- If it is a dense slide, diagram or chart image, upload it to Unraster, look at the free preview, and only pay if it looks right.
- After downloading, proofread text and numbers, set one font, and redraw any arrows you want to follow boxes.
- For data that will change, build a real chart.
For the wider picture, including copying words out with OCR and when Edit Picture is enough, read how to make an image editable in PowerPoint.
Bottom line: PowerPoint's Convert to Shape is for SVG graphics. For a PNG, JPG, chart or diagram, rebuild it: by hand for a few boxes, or with Unraster's image to editable PowerPoint tool for dense ones, which gives you separate text boxes and shapes (not a live chart). Check the preview, then proofread the text and arrows.